The 2022-2023 Winter Forecast
BLOG VERSION OF THE 2022-2023 WINTER FORECAST
FIRST, A REVIEW OF WINTER 2021-2022
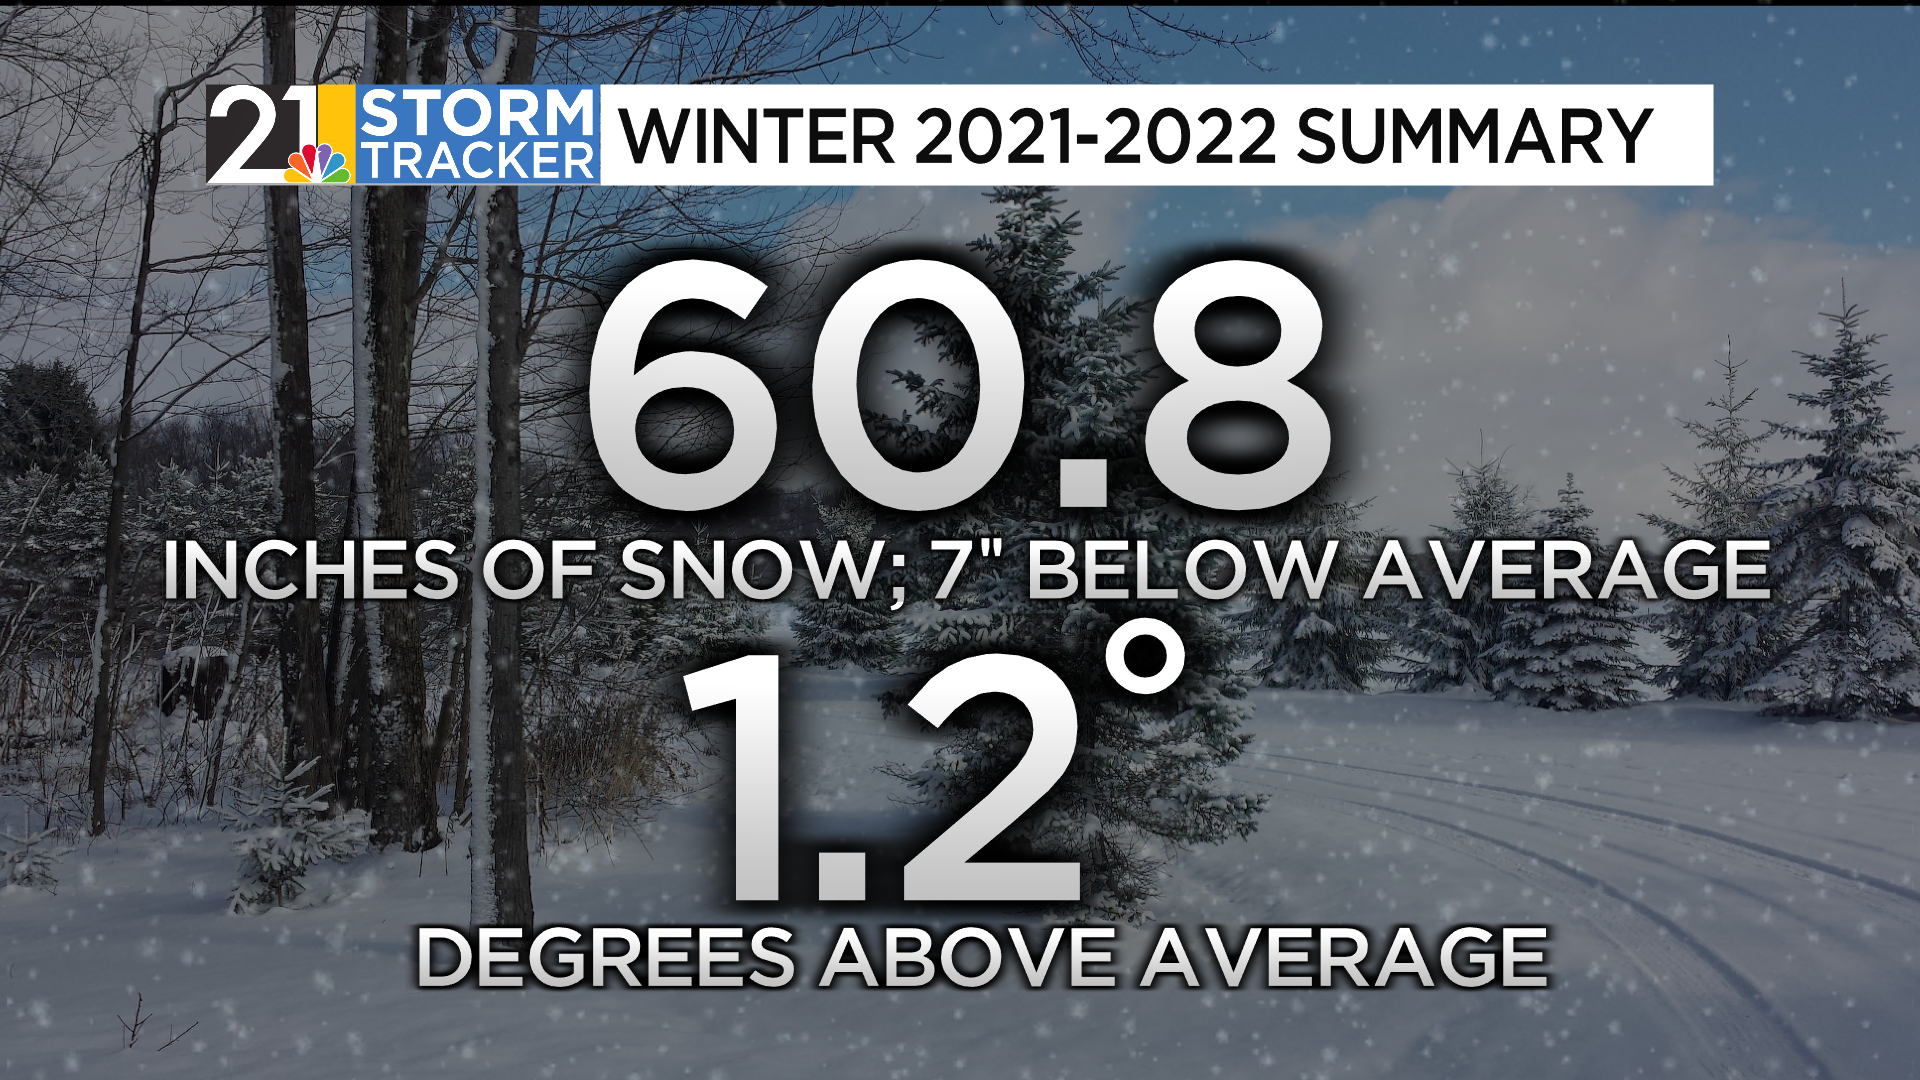
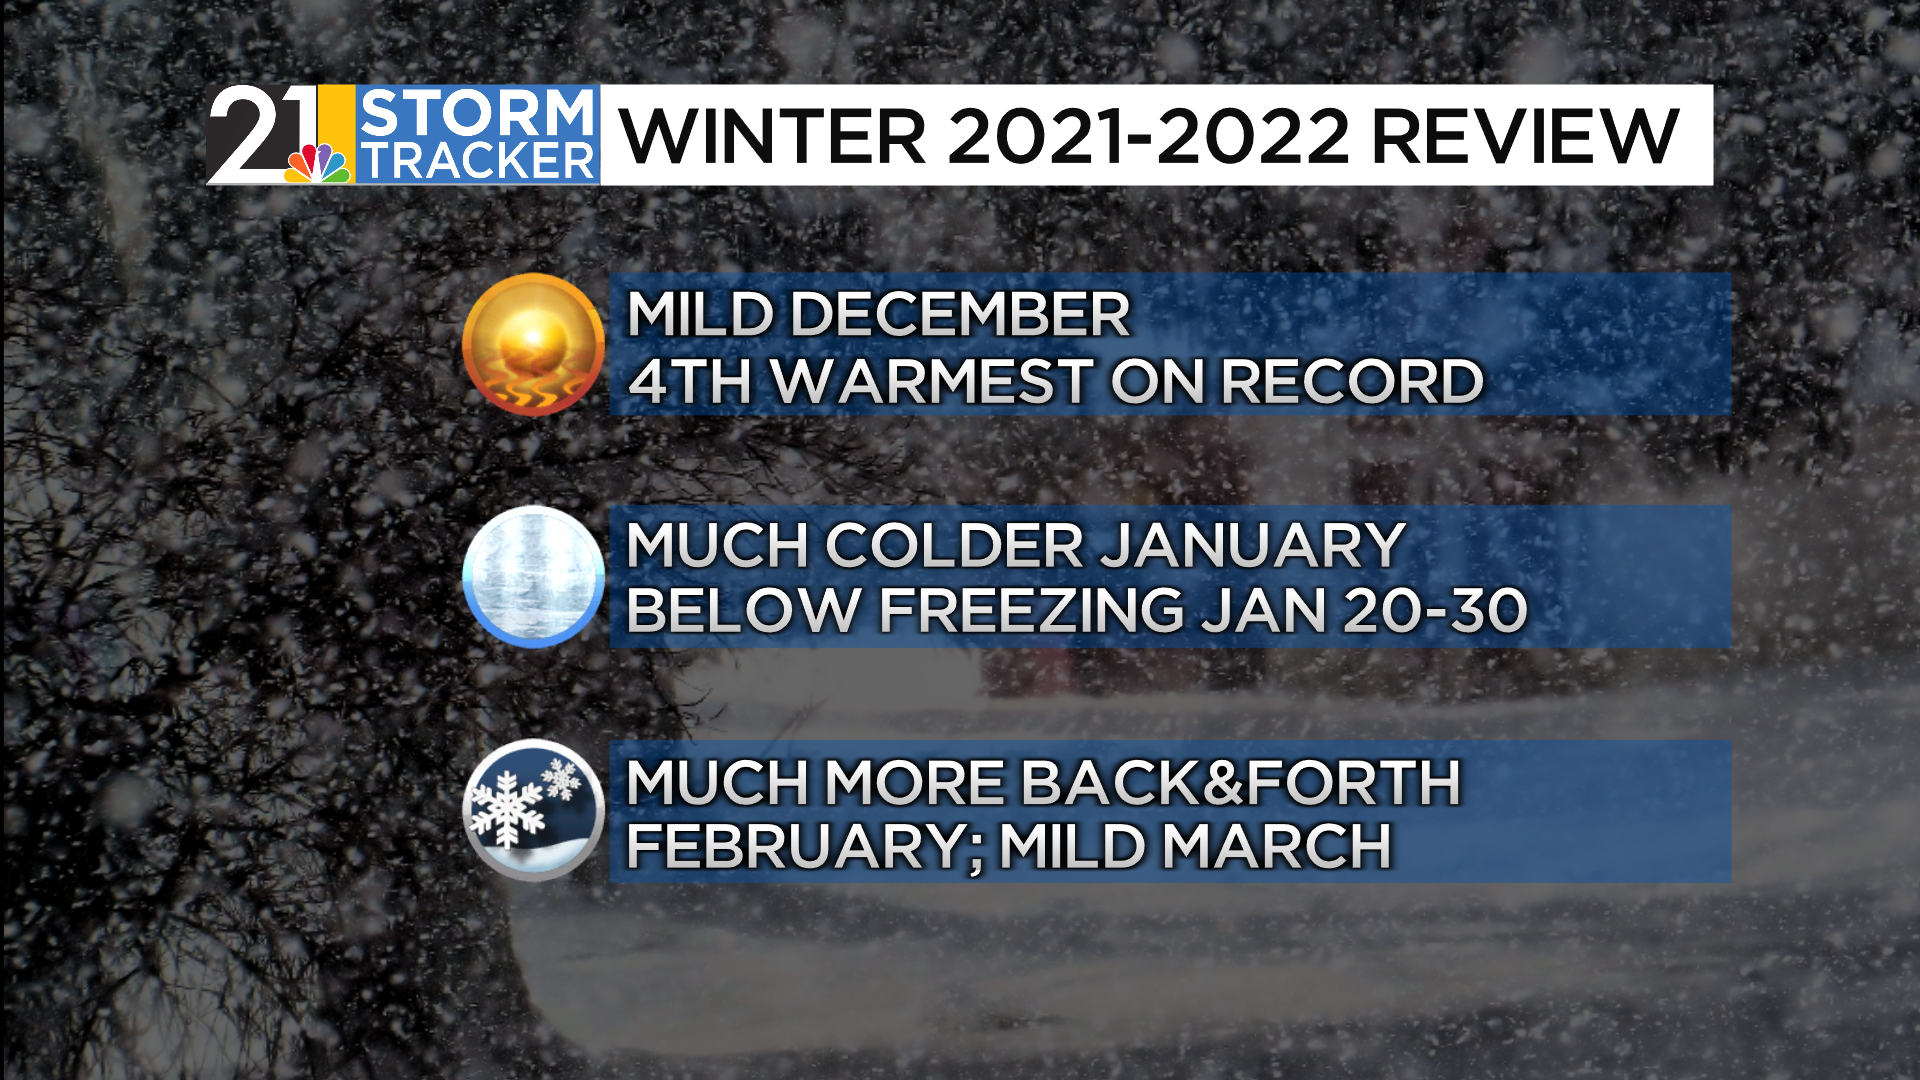
Winter 2021-2022 got off to a slow start, with the 4th warmest December on record. Natually, with weather that warm, we did not see much snow during the first month of Meteorological Winter. However, Winter did stage a pretty good comeback in January, particularly during the final 10 days or so of the month.
February started with a pretty intense winter storm, but the 2nd half of the month featured some big thaws. March was pretty decent for a change with temperatures ending up a few degrees warmer-than-average.
How did our Winter Forecast do? Pretty well! Although we mistimed the core of the cold by a few weeks; we thought late December would be pretty frigid but Old Man Winter didn’t truly set up shop until the 2nd half of January.
IT’S BEEN A WHILE SINCE WE HAVE HAD A TOUGH WINTER
We had a stretch of nasty winters from 2006-2015 but it’s been pretty tolerable since. We have had 7 straight “mild” winters and 4 consecutive winters with below-average snowfall.
CAN WE DO THIS?
Predicting the future is hard, but compared to other professions/hobbies…we do really well! Just ask anyone who predicts football scores or election results for a living. However, for an all-too-large percentage of the public, weather forecasts are met with skepticism. This is partly our fault, as many very good forecasts are rendered useless by poor communication of the forecast. Anyway, a routine daily weather forecast is hard enough to 1) get right and 2) get heard correctly. Can we expect seasonal forecasts to be any different? It’s an uphill battle. These are much different prognostications than the daily stuff.
But yes, there is skill in this. Some years more than others. While our knowledge of pattern drivers and teleconnections and what not is increasing, the atmosphere (and ocean water) that we are trying to get a handle on are changing fast. It’s harder to rely on the not-too-distant past, when the Earth of 40+ years ago was so different. Thankfully some of the best minds in the weather enterprise are working diligently at solving this problem.
OK, SO HOW DO WE DO THIS?
Because even the best computer models do not have a high amount of skill in predicting how an invisible, unstable fluid sitting on top of a rotating sphere will behave weeks and months into the future, the #1 tool in our tool box is “analogs”. We look at past years that had similar “ingredients” as this year. We often start with El Nino/La Nina. This year is another La Nina winter (more on that later) so we first narrow down the analog years to La Nina years…and go from there.
We use computer models, but cautiously.
A lot of mistakes are made and lessons are learned in this seasonal prediction endeavor. Good forecasters will note when and why things went sideways and strive not too make the same missteps again.
WINTER ALPHABET SOUP
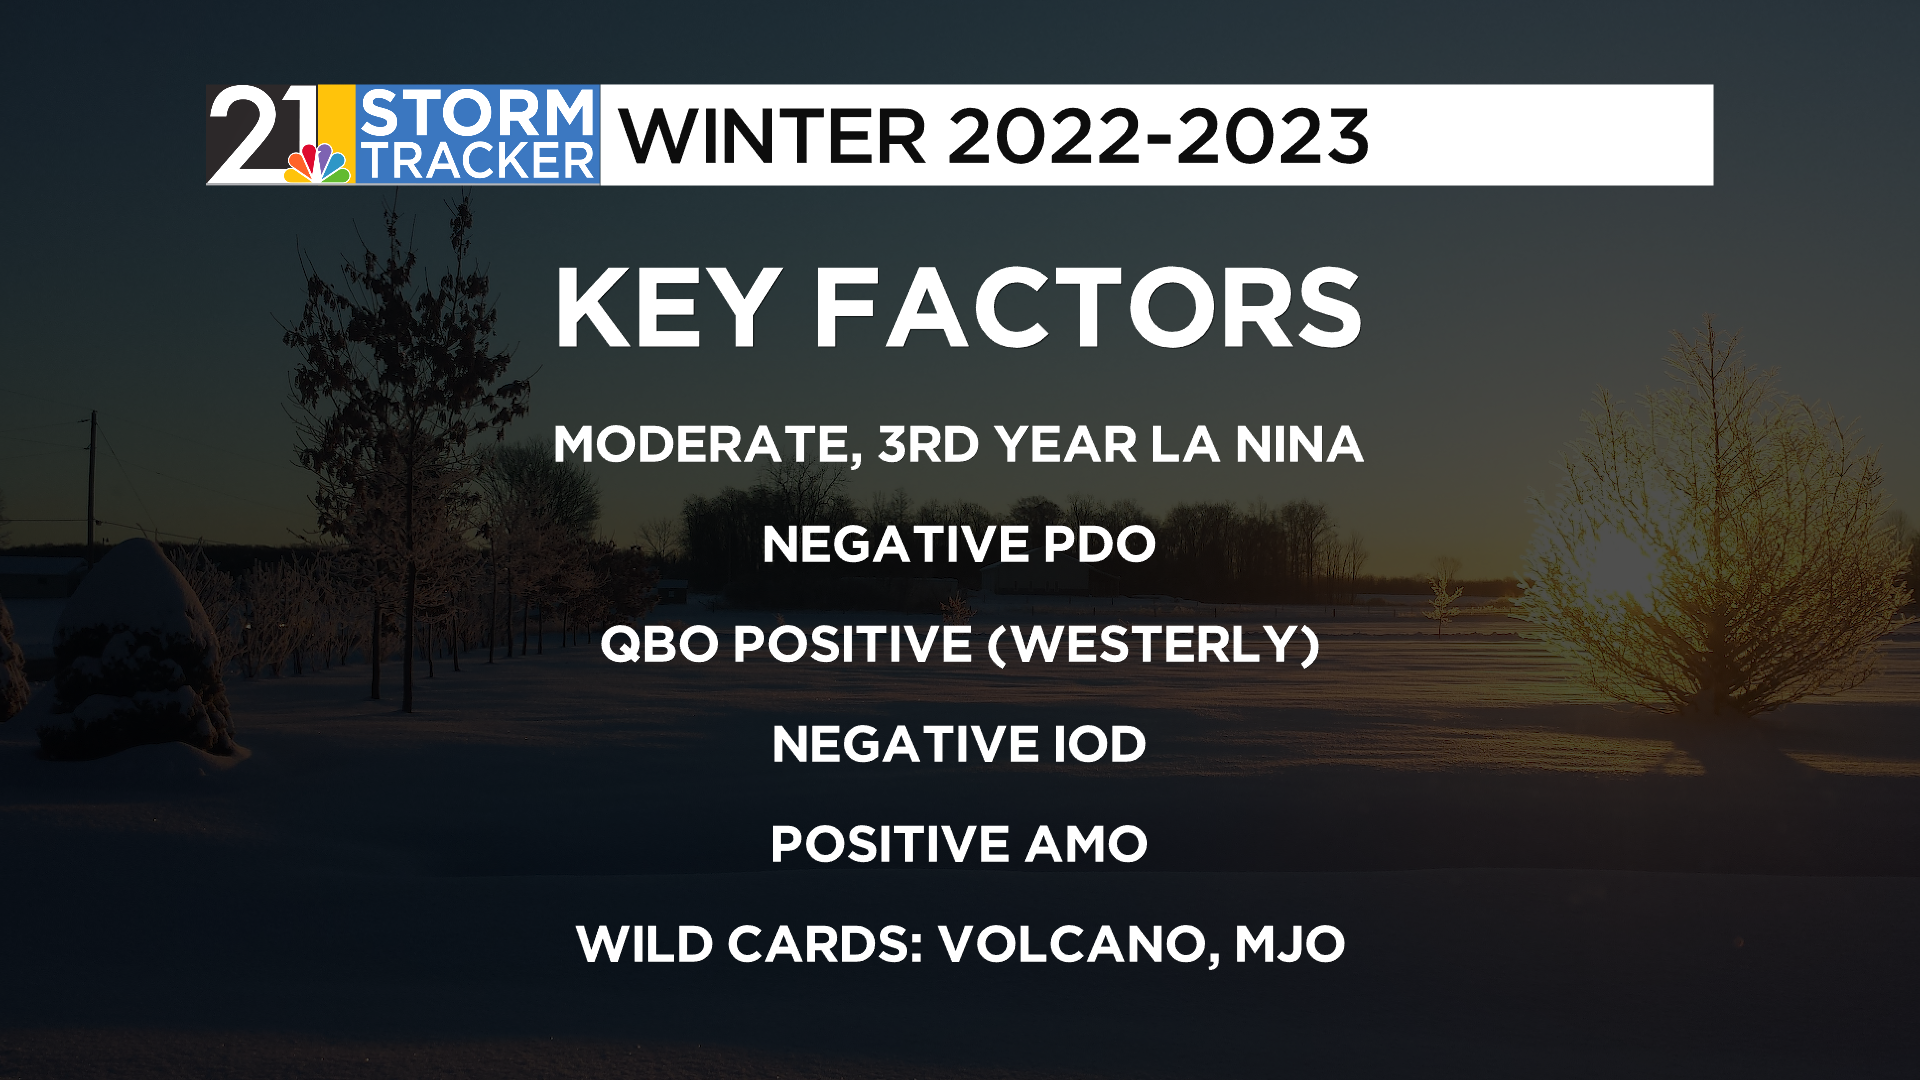
What are the key factors this year? This is a rare “triple dip” La Nina, in other words, the 3rd straight Winter in which La Nina is present in the Pacific (again more on that coming up). Other atmospheric and oceanic drivers are listed below and we’ll investigate them more as we move forward.
STATE OF THE OCEANS
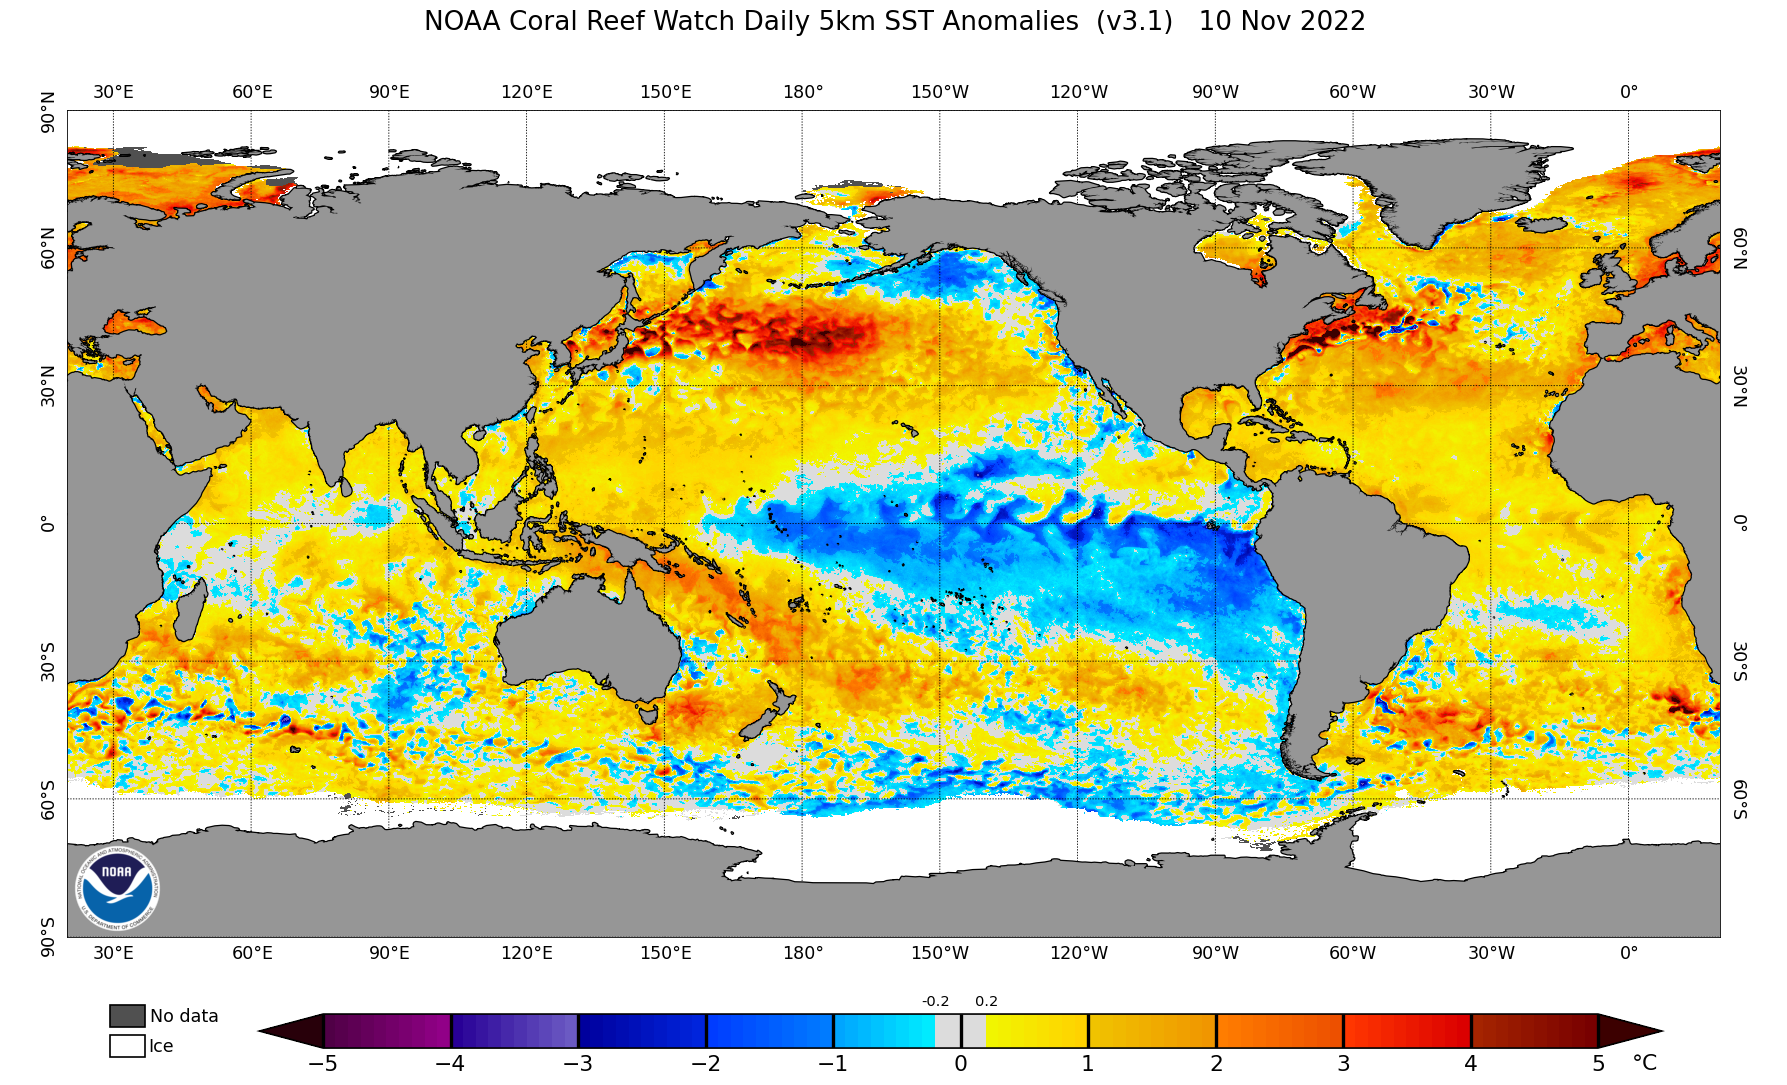
The atmosphere sits atop the surface of the Earth, of which the majority is covered by water. The planet’s oceans have a large influence on the atmosphere (and vice versa). In the below image, your eye is certainly drawn to the big blue area in the Pacific. There’s La Nina. It’s a strip of cooler-than-average water, caused by a strengthening of the trade winds in the equatorial Pacific...which causes cooler water under the surface of the ocean to “upwell”.
Other things to note:
1) The very warm water in the northern Atlantic . This is the “warm” phase of the "Atlantic Multidecadal Oscillation” or AMO. As the same implies, this oscillation changes from warm to cold and back to warm over the course of large chunks of time. That said, there are instances within these long time frames in which the water in this area warms or cools somewhat. This autumn, the magnitude of the warm AMO has been quite high….September’s value was the highest since the autumn of 2010.
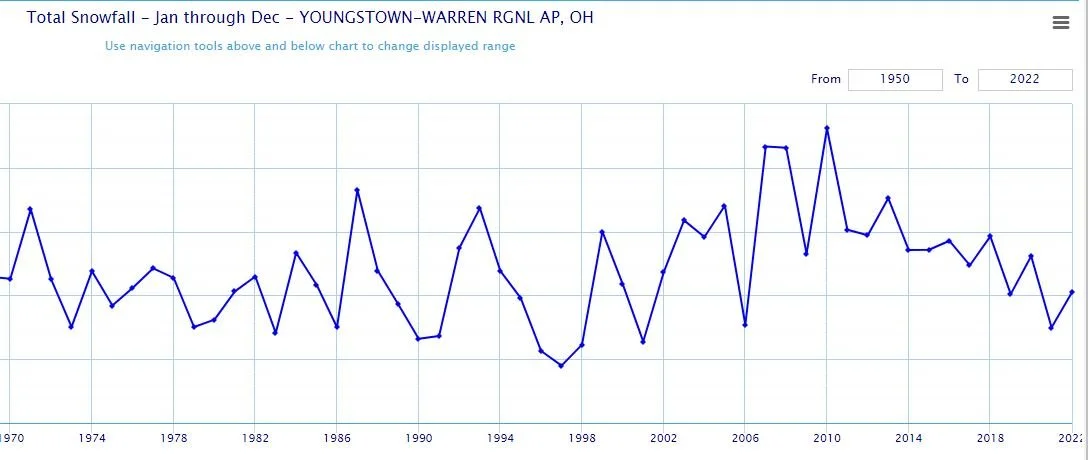
The AMO can play an interesting role in the amount of precipitation our area gets. This includes snow in the winter. Notice the correlation between annual snow totals and the “warm” phase of the AMO taking over around the turn of the century. It stands in stark contrast to the “cold” phase the preceded it, which was a time of less annual snowfall in our area.
Not every year in a warm AMO is going to be snowy (as the last few years have shown) and some of the increase in precipitation in recent times can be attributed to climate change. However, I think there is definitely a notable correlation between AMO phase and long-term precipitation/snowfall trends in our area.
2) The warm tongue in the NW Pacific. This water temperature pattern is the ”cool” or negative phase of the Pacific Decadal Oscillation or PDO. A negative PDO can help keep the lower 48 states, especially the East, milder than average in Winter.
3) The very warm water north of Australia and the relatively cool water in the western Indian Ocean. The is the “negative” phase of the Indian Ocean Dipole, or IOD. Yes, we look at ocean temperatures way over there. The IOD phase can be important when we try to suss out trends in the MJO (more 3 letter stuff!), which is important and we will talk about in a bit.
LA NINA/EL NINO AND OUR WINTER
La Nina (and it’s opposite, El Nino) is a very important driver for Northern Hemisphere weather patterns during Winter. It’s not the only driver by any stretch of the imagination, but it has the capability of being the top dog, especially if it is strong.
In our area, an extreme Winter (either warm or cold) seems to happen more frequently with El Nino rather than La NIna…although very warm Winters do happen more frequently with La Nina or neutral conditions (Very strong El Ninos being the exception). Some of our coldest winters on record have occurred in weak El Ninos.
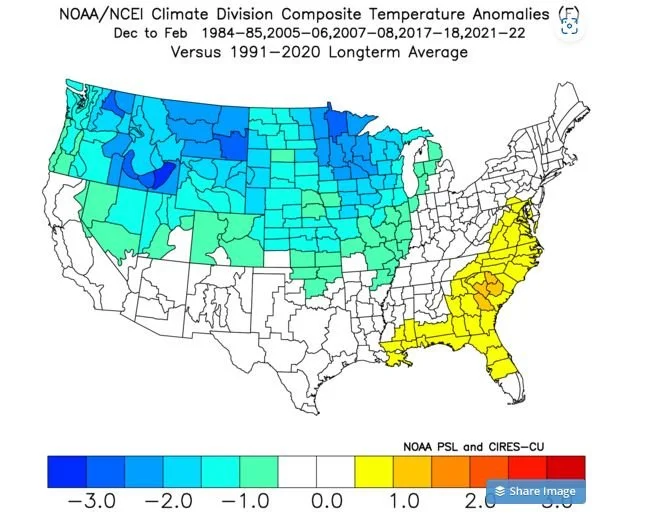
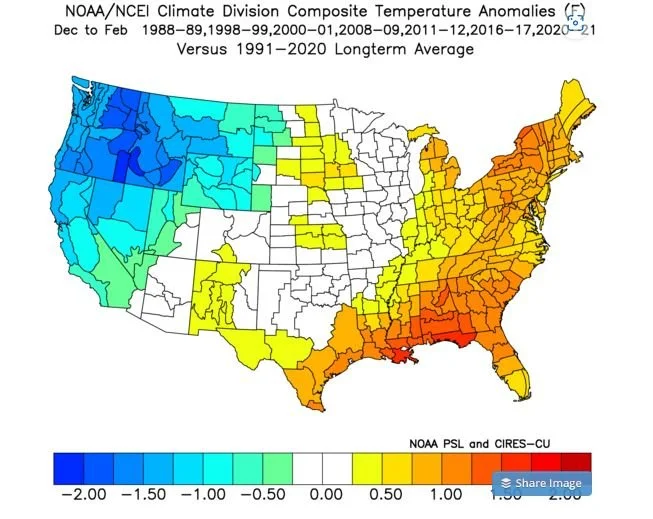
Every La Nina/El Nino is built differently. Not only are some stronger than others, but the location of the coldest(or warmest) water is quite important. An “east based” La Nina, in which the coldest waters are closer to South America, tends to favor a colder outcome in the eastern US than a “central based” La Nina, in which the coldest waters are anchored toward the middle of the Pacific.
Check out these temperature composites. The first are recent years in which La Nina was “east based” and the second shows temperature anomalies for “central based” La Ninas.
Heading into Winter 2022-2023, La Nina is east based, and by a fair margin.
WHAT IS THE QBO?
Let’s step away from the oceans for a minute and talk about the atmosphere, specifically the upper atmosphere. There is a belt of winds above the equator that can impact weather patterns during the Northern Hemisphere Winter. These winds change direction roughly every 14 months. This is the Quasi-Biennial Oscillation, or QBO. Why do we care? Well it’s been shown that the negative (or easterly) phase of the QBO can open the door to more frequent disruptions of the POLAR VORTEX than the positive (westerly) phase. The POLAR VORTEX is a term that was grabbed by television producers and social media influencers almost a decade ago as a means of describing the cold weather during the back to back winters of 2013-14 and 2014-15. The truth is, the polar vortex always exists in the winter and, perhaps counterintuitively, only impacts our weather significantly when it is WEAK, or disrupted. A strong polar vortex stays above the North Pole and keeps the coldest air up there with it.
The most significant polar vortex disruptions are associated with a “Sudden Stratospheric Warming” event. This is when the air gets real warm (relatively speaking) way up there are like the 100,000 foot level. This intrusion of weird warmth sends the normally orderly polar vortex into fits of rage and it then can REALLY throw a load of very cold air very far to the south.
SSWs CAN occur in the “positive” phase of the QBO, but are much more common when it’s negative. Also, when the do happen in a positive QBO, the cold tends to be directed farther west in the US.
Temperature anomalies in winters (since 1980) with a SSW and a positive QBO:
And during negative QBOs:
This year we have a positive, or westerly QBO. This should decrease the odds of a prolonged intrusion of severe cold air.
MORE ACRONYMS. WHAT’S THE MJO??
Ok, now let’s talk about an oscillation that has both atmospheric and oceanic components. The Madden-Julian Oscillation is a semi-permanent cluster of thunderstorms that takes a walk through the Indian Ocean and into the Pacific. It’s so large and such a player that it can muscle the jet stream to do things. Depending on how robust the MJO is, and where it’s located at any given time, the pattern way over here in North America can favor warm or cold weather.
Remember the Indian Ocean Dipole (IOD) I mentioned above? A negative IOD tends to force the MJO to want to hang out more often over regions of the far eastern Indian Ocean and western Pacific that favor eastern US warmth. Tends to.
TOP ANALOGS FOR 2022-2023
Ok, so we just went over some key factors for this winter. East-based, moderate La Nina (that will likely fade as the winter wears on), a positive QBO, a positive AMO, a negative PDO. I tried to find years that best match that combination (also factored in how the Novembers preceding those winters went). Here’s my list of top “analogs”. No analog is perfect! But some are a pretty decent match.
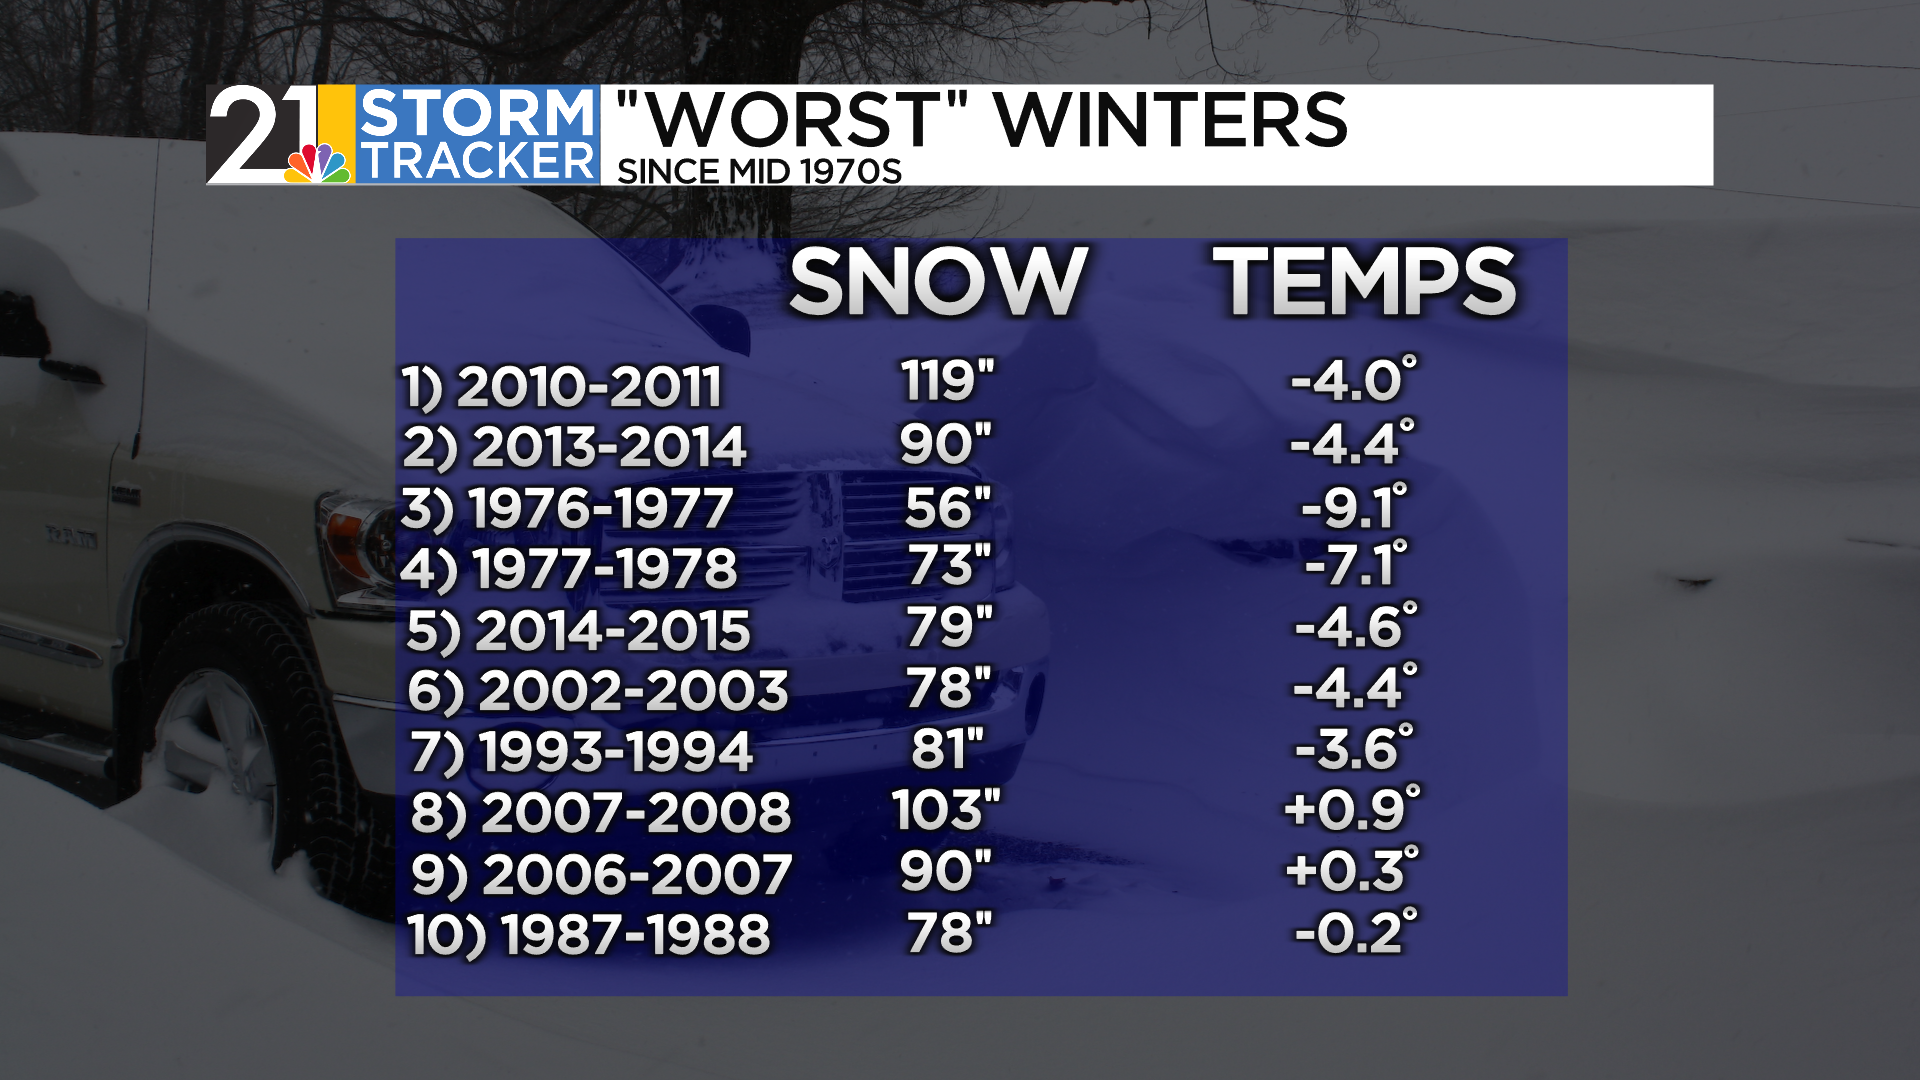
Ok, so let’s examine that list. No crazy warm winters but only a couple of cold ones. The coldest one on the list, 2010-2011 is actually our “worst” winter on record here. So much snow!
There are 4 winters with above-average snow (2 of which were really whoppers) and 5 with below-average snow.
Composite of the analogs…first, temperatures:
And precipitation:
COMPUTER MODELS
Analogs form the backbone of the forecast, but we do consider what the latest long-range weather models have to say. Here’s a sampling of some of the most recent:
3 of the 4 are fairly similar, with the one on the bottom exhibiting a colder look.
SO LET’S GET TO THE FORECAST
We have walked through the various “drivers” this season, how the analogs and some of the computer models look. Let’s get to the forecast! Based on the models and many of our analogs…it should be another mild winter, right? Let’s review:
THINGS THAT CAN TILT THE ODDS IN FAVOR OF A MILD WINTER:
1) The Negative PDO.
2) The Negative IOD, which can force the MJO into “warm” phases more often.
3) The Positive (or westerly) QBO, which lowers the chance for the polar vortex to send the Mother Of Cold Shots in our direction.
4) Recent history. We know that we will have a cold winter eventually, but would you bet on it? The smart money has been on mild temperatures and near/below average snow.
THINGS THAT CAN TILT THE ODDS IN FAVOR OF A COLDER WINTER
1) A stout, east-based La Nina as opposed to a central Pacific-based La Nina.
2) The very warm northern Atlantic, which might lead to more “blocking” there/near Greenland…which can force cold into the East with more frequency (and increase snow totals as well).
3) We are due.
A WILD CARD?
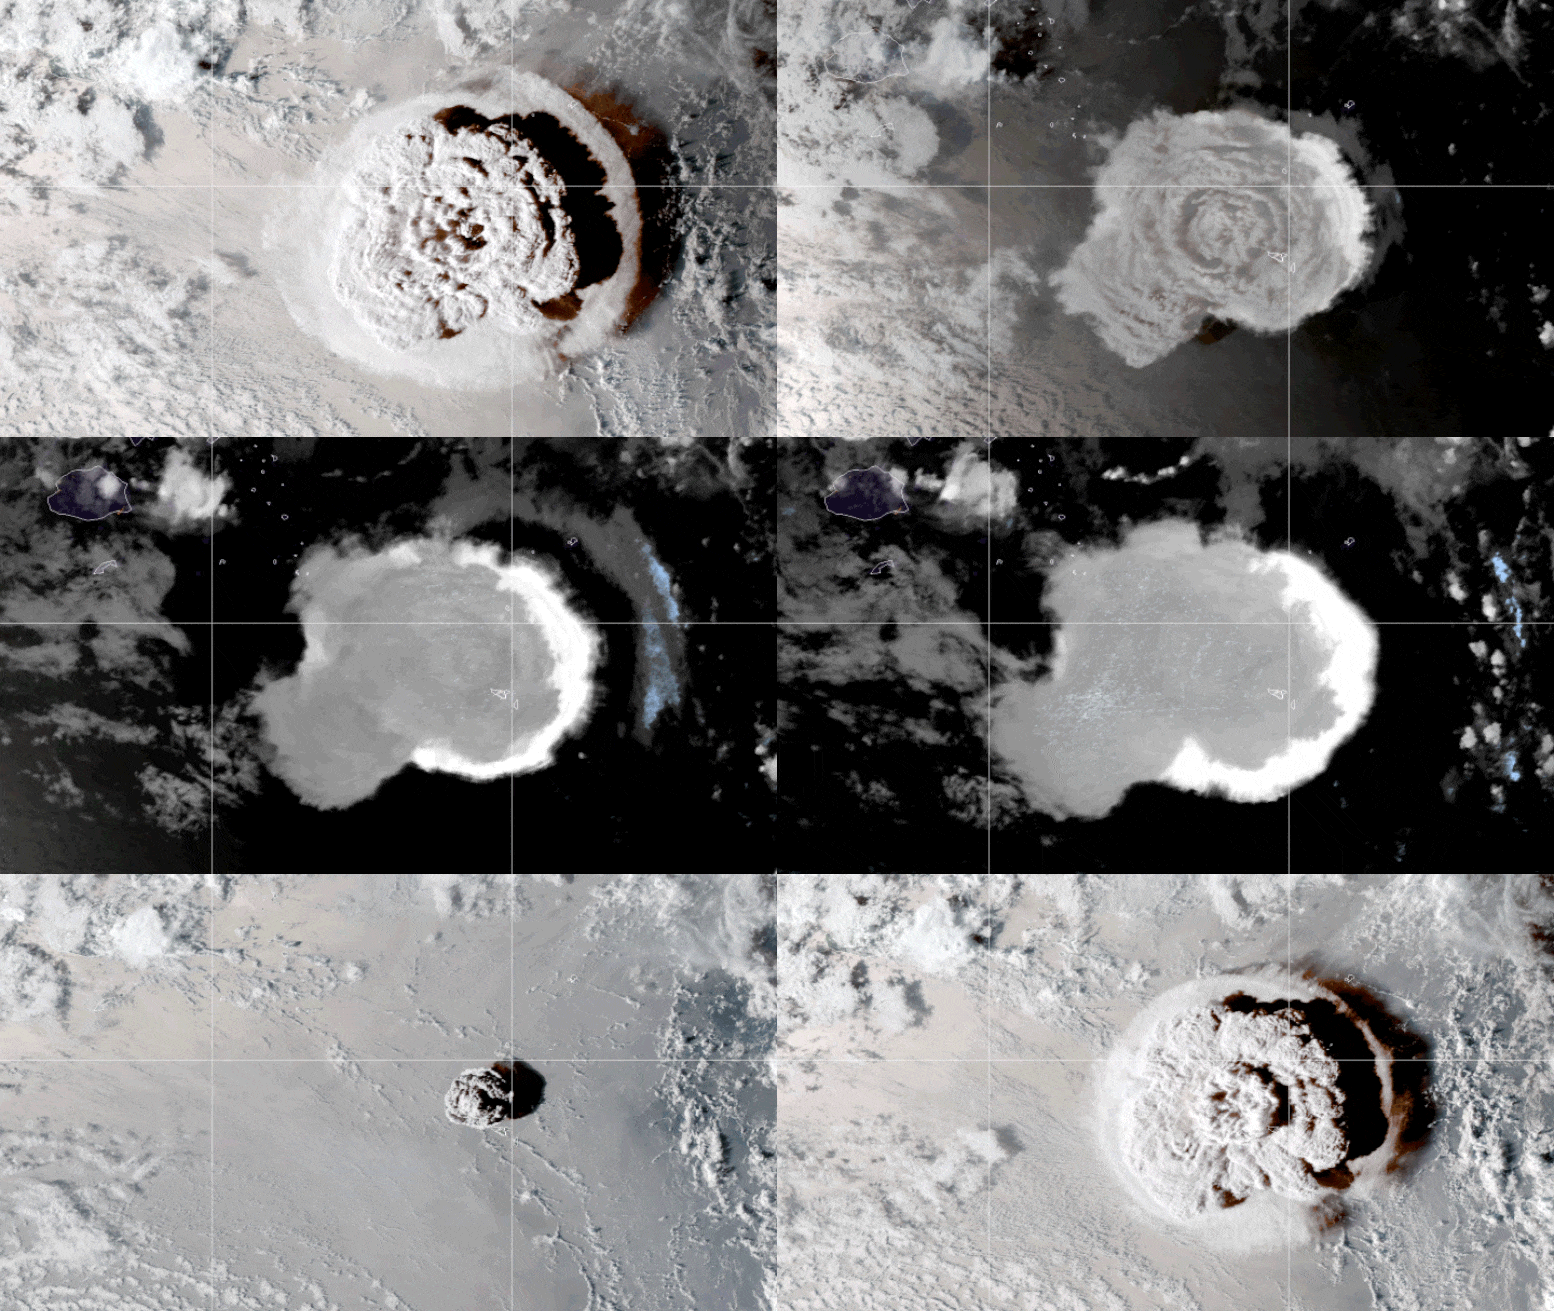
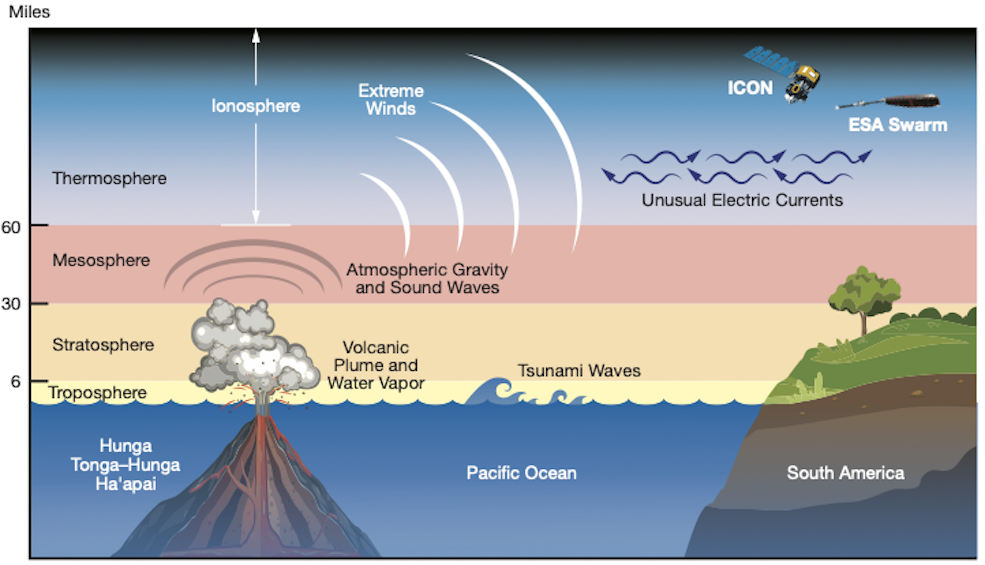
In January 2022, the Hunga Tonga-Hunga Ha'apai volcano, in the southwest Pacific erupted.
Since this is a “submarine” or underwater volcano, the eruption launched an enormous amount of water vapor high in the atmosphere. Normally, ash from large volcanic eruptions has a cooling effect on the Earth’s climate as it can block incoming solar radiation. Water vapor, however, is more of a greenhouse gas and can “trap” heat (this is why a clear, humid night in the summer is warmer than a clear night with dry air overhead).
Will this excess water vapor high in the atmosphere have an impact on the Northern Hemisphere winter? Will it make for warmer temperatures? Will it strengthen the polar vortex, making it less likely to meander south? Maybe. We don’t really know.
So, here’s what we came up with. A temperature forecast that is 1) warmer than the analog composite and 2) colder than the models.
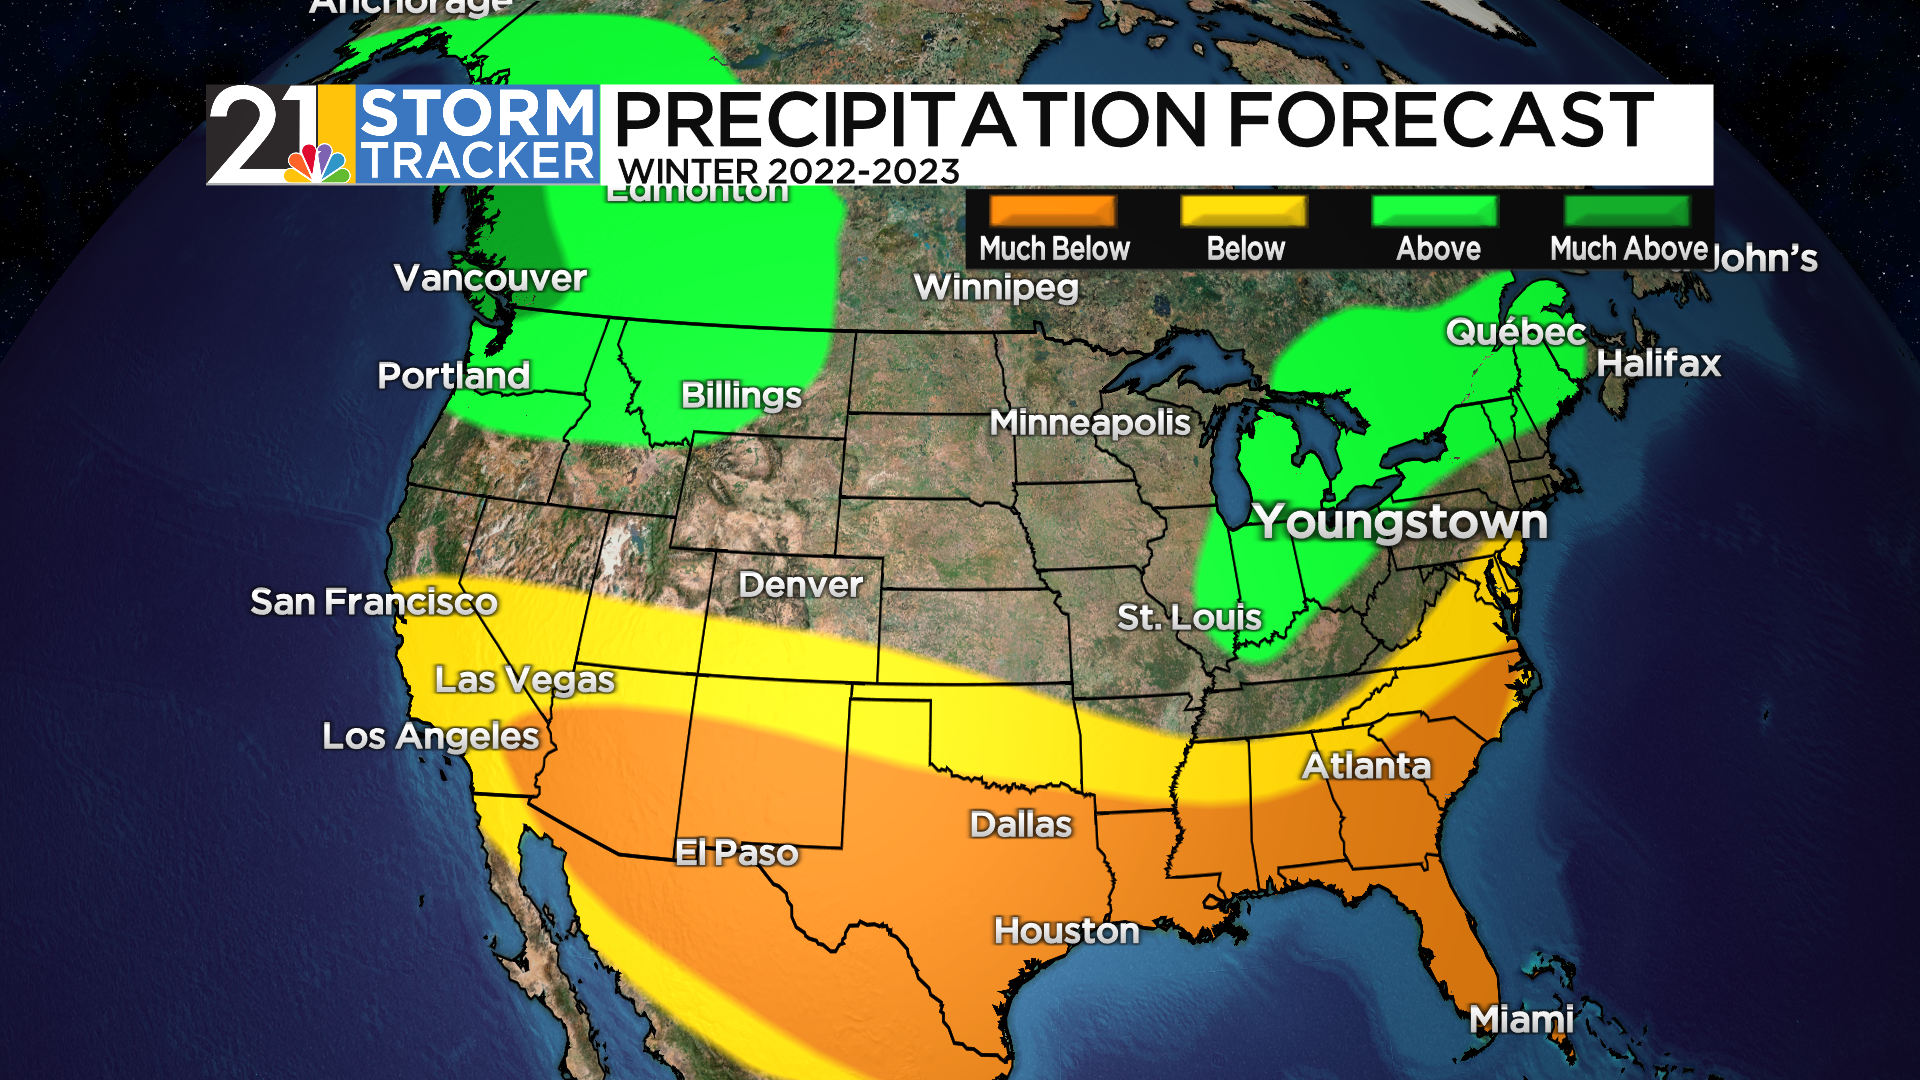
Factoring in recent trends, the precipitation map (for our area) is wetter looking the analog blend:
The snow forecast won’t make snow lover’s mouths wet, but I do think there is a decent chance of this being the snowiest winter since 2017-2018.
These graphics show the most likely outcomes, but what are the odds of some different outcomes? When it comes to temperatures, I think the odds of winter being near average and somewhat colder than average are roughly equal. The odds of a severely cold winter are low, but higher than the odds of a “blow torch” winter like 2011-2012.
In the snow department, the highest odds are for “near average” amounts, with the next most likely outcome being a snowier-than-average season.
THIS YEAR VS. LAST YEAR
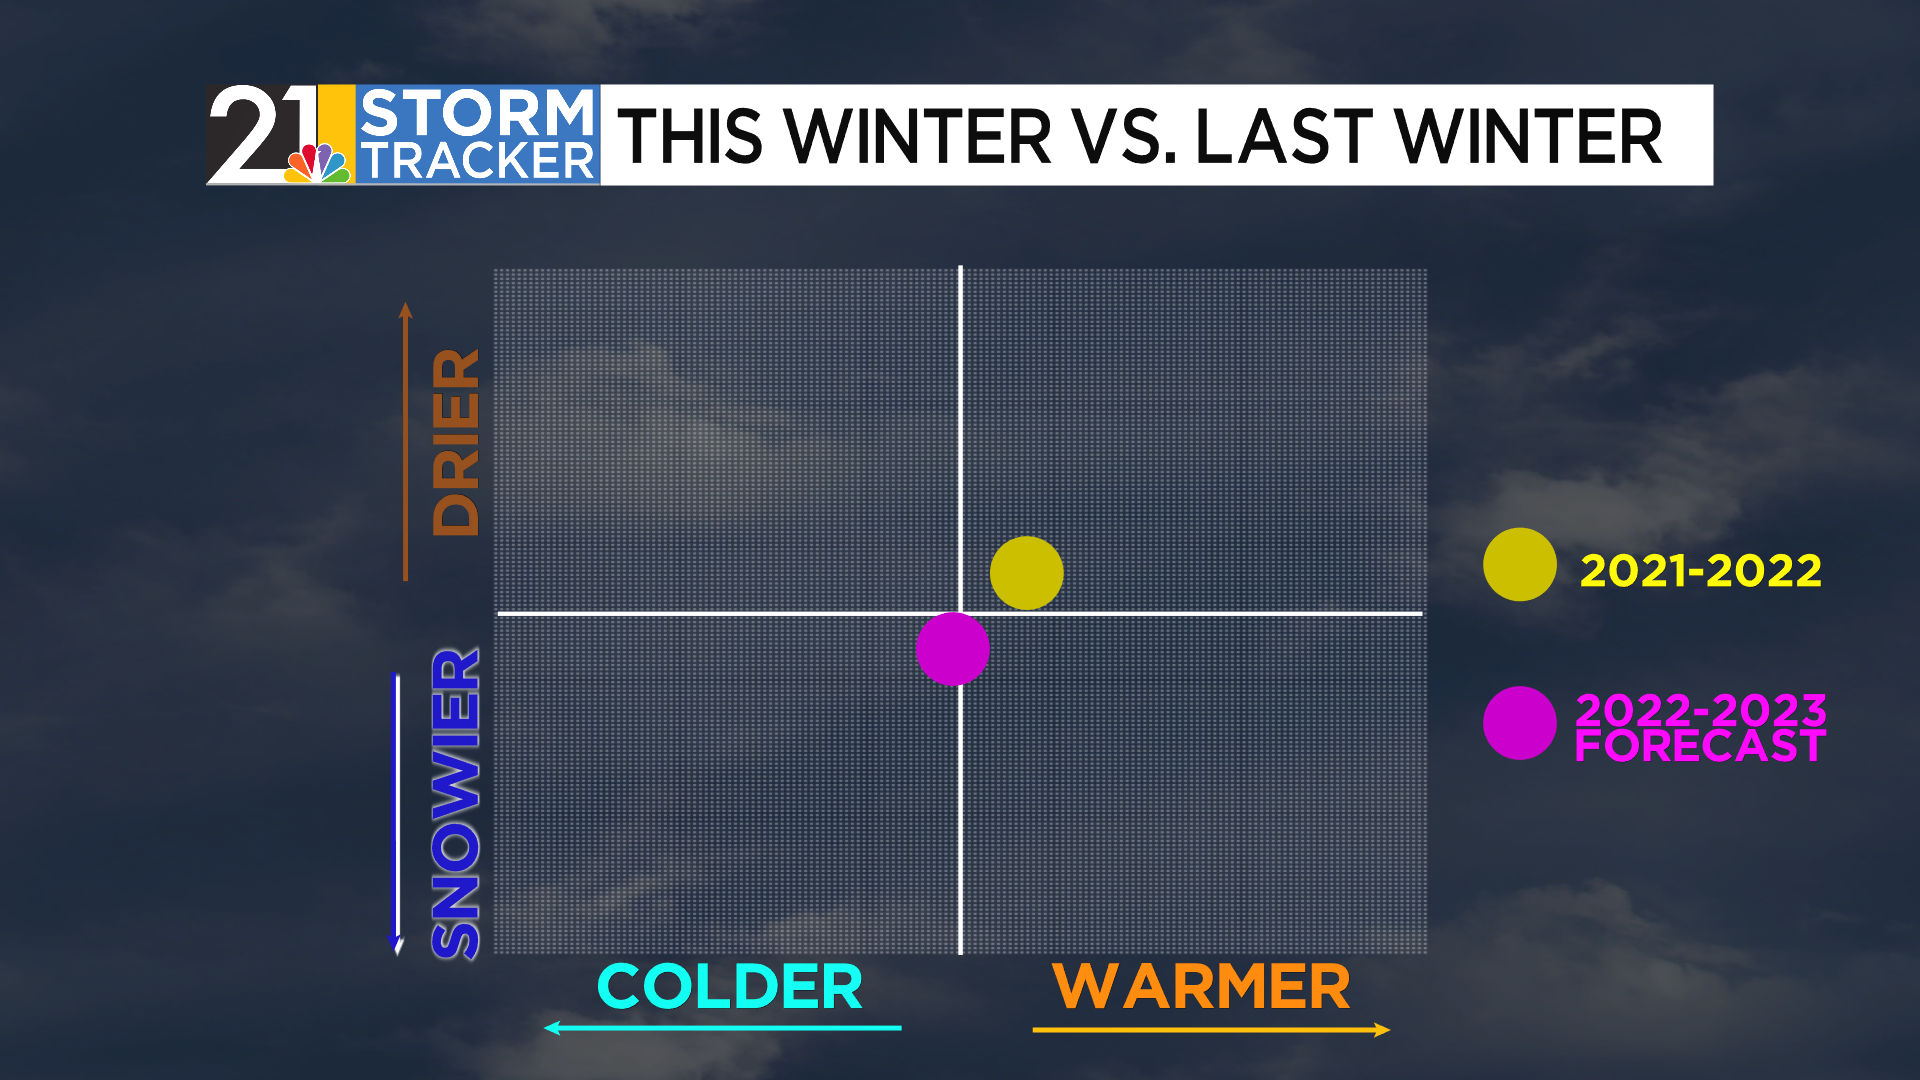
or the most part, it’s just us weather weenies that accurately remember details of many winters past. Most people remember the most recent winter. So how will this year compare to last? Probably a little colder and a little snowier.
THE BOTTOM LINE
Let’s bring this plane in for a landing. Winter 2022-2023 is likely to start fairly mild in early December, with a good chance for colder weather winning out as the month wears on. It should overall be a much colder, more typical December than in 2021. The forecast for the season is tricky with some competing signals. It’s unlikely to be a harsh winter, like 2010-2011 but there’s a reasonable chance it’s perceived as “tough” because of recent history. Lastly, there is a strong signal in the analogs that the season can wind down quickly in late February and into March. Hopefully this isn’t me wishcasting!

