The 2021-2022 Winter Forecast-Blog Version
BEFORE WE GET TO THIS YEAR, HOW’D WE DO LAST YEAR?
The overall idea last year was that we would have a pretty mild Winter with snowfall near or a little below average. Well December 2020 was very snowy (30.4”, the 2nd snowiest December on record) but it was not super cold. January was pretty tame with much less snow (8.8”). So the forecast was doing pretty well. Then…February came. It was easily the coldest month compared to average (-3.5 degrees) and it ensured that the season as a while would end up just a little above average. So our forecast ended up being too warm.
Last year was a La Nina Winter (more on that later) and those are typically fairly wet (rain, snow and everything in between) but last year was an exception.
Last year was the 2nd year in a row in which I was less than happy with how the forecast panned out. Lessons were learned!
SO, ARE THESE FORECASTS A CRAP SHOOT? WHAT’S THE DIFFERENCE BETWEEN THIS AND THE FARMER’S ALMANAC?
There is absolutely skill in seasonal forecasts when they are done following scientific principles. Meteorologists in all sectors of the weather enterprise put, at minimum, at least part of their reputation on the line when they issue these outlooks. Meteorologists who work for energy firms and with commodity traders make long-range outlooks in which millions of dollars is on the line. Those types of meteorologists would not be paid so handsomely if they were simply guessing or throwing darts at some sort of magical weather dartboard.
Seasonal forecasts by reputable meteorologists can be trusted although of course not every forecast is going to be on the mark. This is tricky business!
Meanwhile, the good ol’ Farmer’s Almanac is a fun publication that was some interesting stuff in it but the forecasts contained within are “for entertainment only”. Unfortunately some take those forecasts pretty seriously! Just like when I rant about tornado sirens, I’m always a bit perplexed by how many people will defend the Farmer’s Almanac to the death.
The techniques used in making these seasonal forecasts have gotten much better in recent years. Our knowledge of how atmospheric and oceanic features interact to influence global weather patterns has increased dramatically over the last few decades. BUT! Climate change is making this somewhat harder. The atmosphere and oceans are rapidly warming and this fact increases the chance for “surprises”, things we have not seen before, etc.
THIS HAS BEEN QUITE A RUN OF WARM WINTERS
Winter 2020-2021 ended up about 0.8 degrees warmer-than-average, making it the 6th mild Winter in a row. 8 of the last 10 have been “not that cold”.
HOW ARE THESE FORECASTS MADE?
Seasonal outlooks, much like the typical 7-day forecast you get on an app or from a meteorologist on TV, use a blend of computer model information and the forecaster’s experience/intuition. However, the most important ingredient is something we really don’t use in those typical daily forecasts. “Analogs” provide the foundation for the seasonal forecast. We pour through data to find years in the past in which there were similar conditions in some key areas in our oceans and also in our atmosphere. We even look at such far-flung places as the Indian Ocean and the stratosphere miles above our heads. We then keep digging through the data to see what happened those winters. That, theoretically can give us a starting point for our forecast for the upcoming winter.
KEY FACTORS THIS WINTER
This winter will be the 2nd in a row to feature a La Nina, which will will discuss momentarily. Other items of interest include cool water in the northeast Pacific Ocean, a pool of warmer-than-average water in the eastern Indian Ocean and a “negative” phase of something called the QBO. Plus: everyone’s favorite winter buzzword(s): the polar vortex.
LA NINA
La Nina is the cooling of the waters in a key part of the Pacific Ocean, near the equator. When this occurs, weather patterns are often altered over North America. BUT not all La Ninas are alike. The strength of the Nina and the location of the coolest water can make a big difference.
This Autumn’s La Nina should peak right at the edge of weak/moderate. It’ll likely be a little less intense than last season’s. The Nina should rapidly weaken late in the Winter and early in the Spring.
A look at water temperature anomalies shows some of the key features mentioned above:
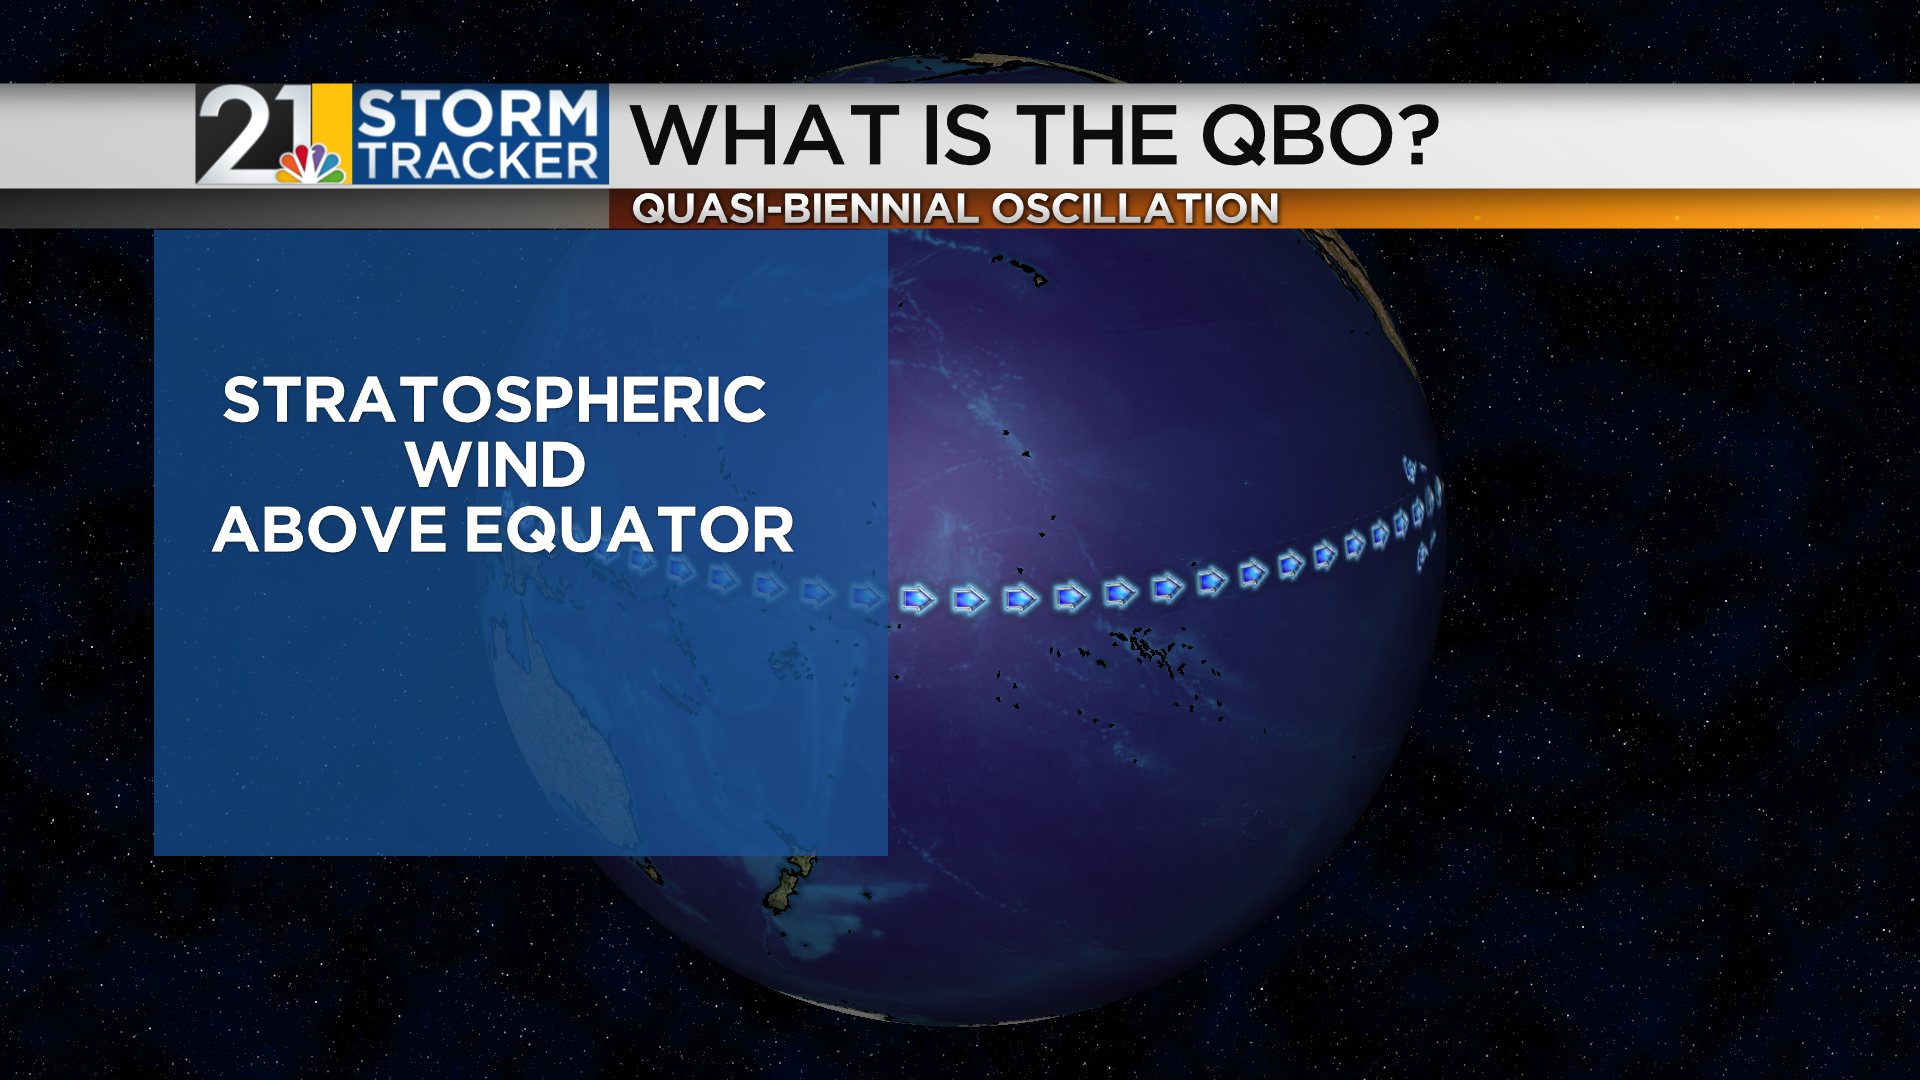
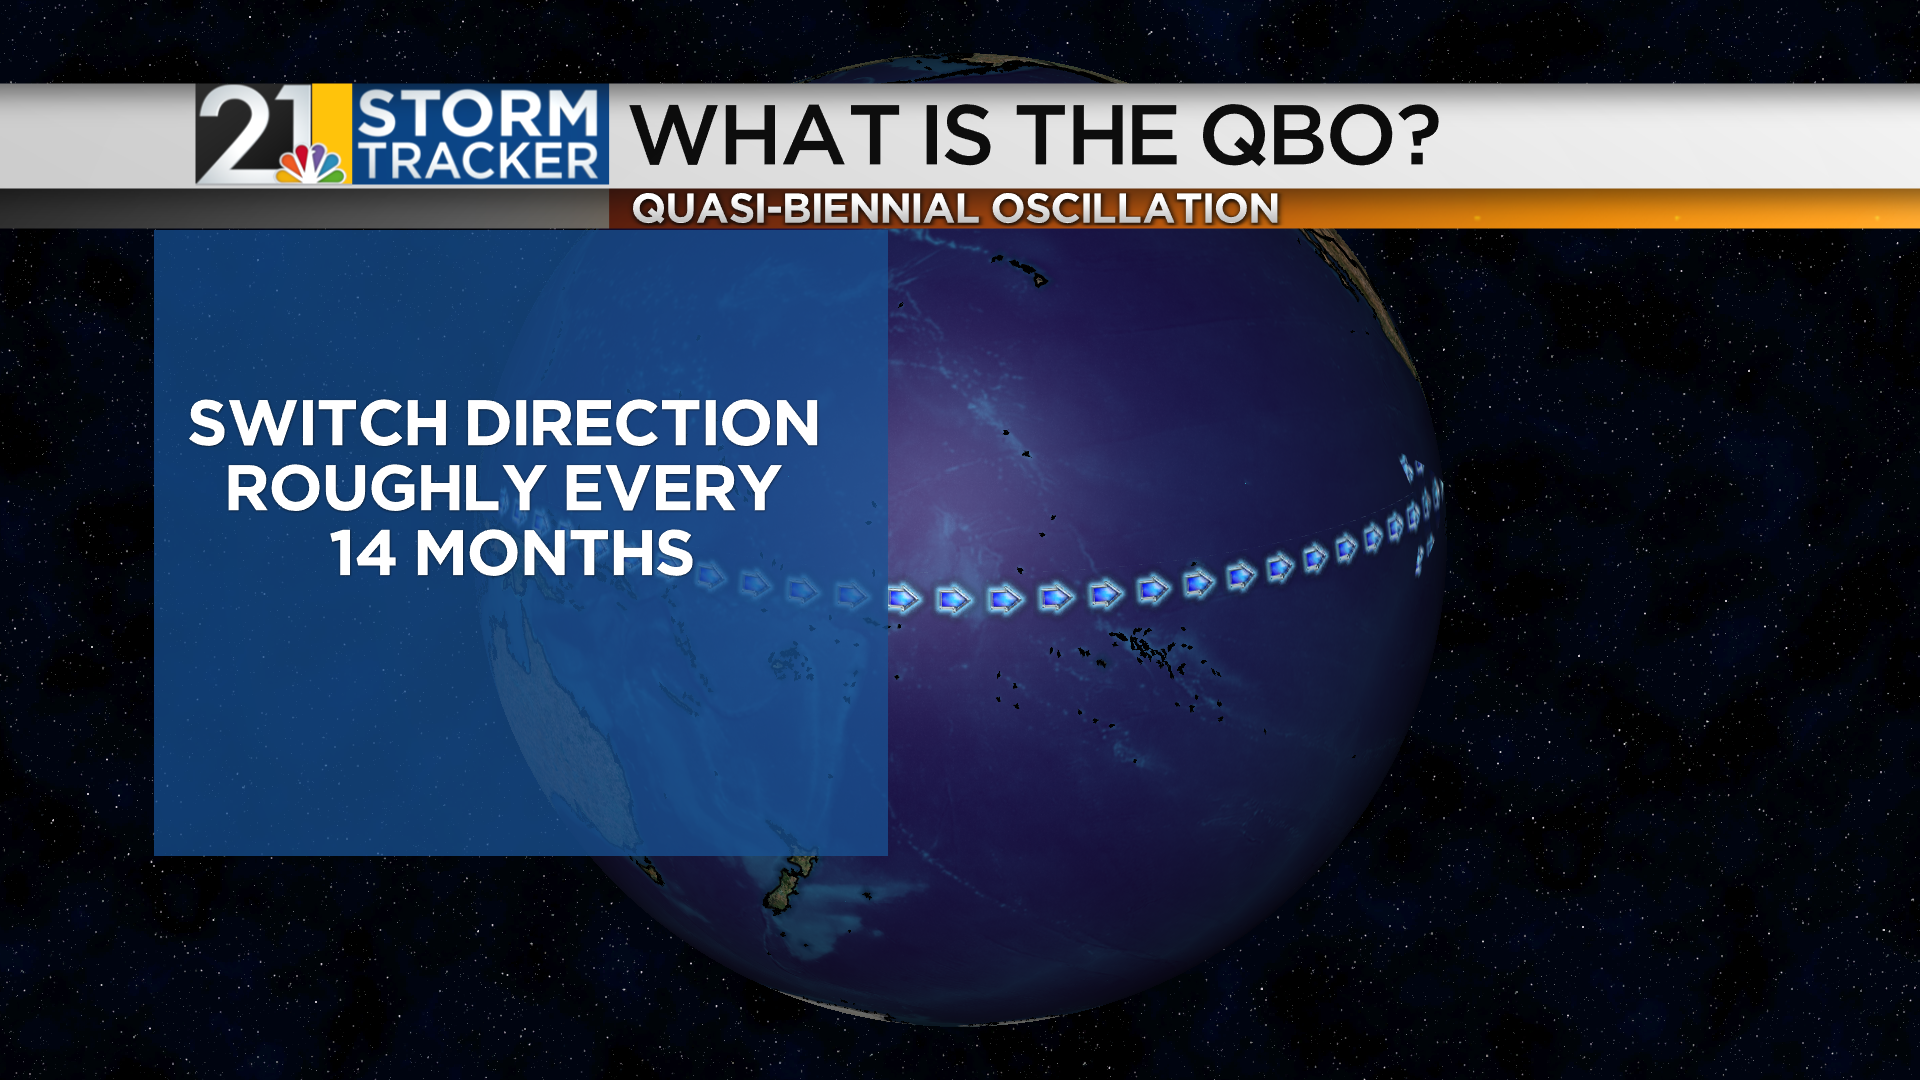
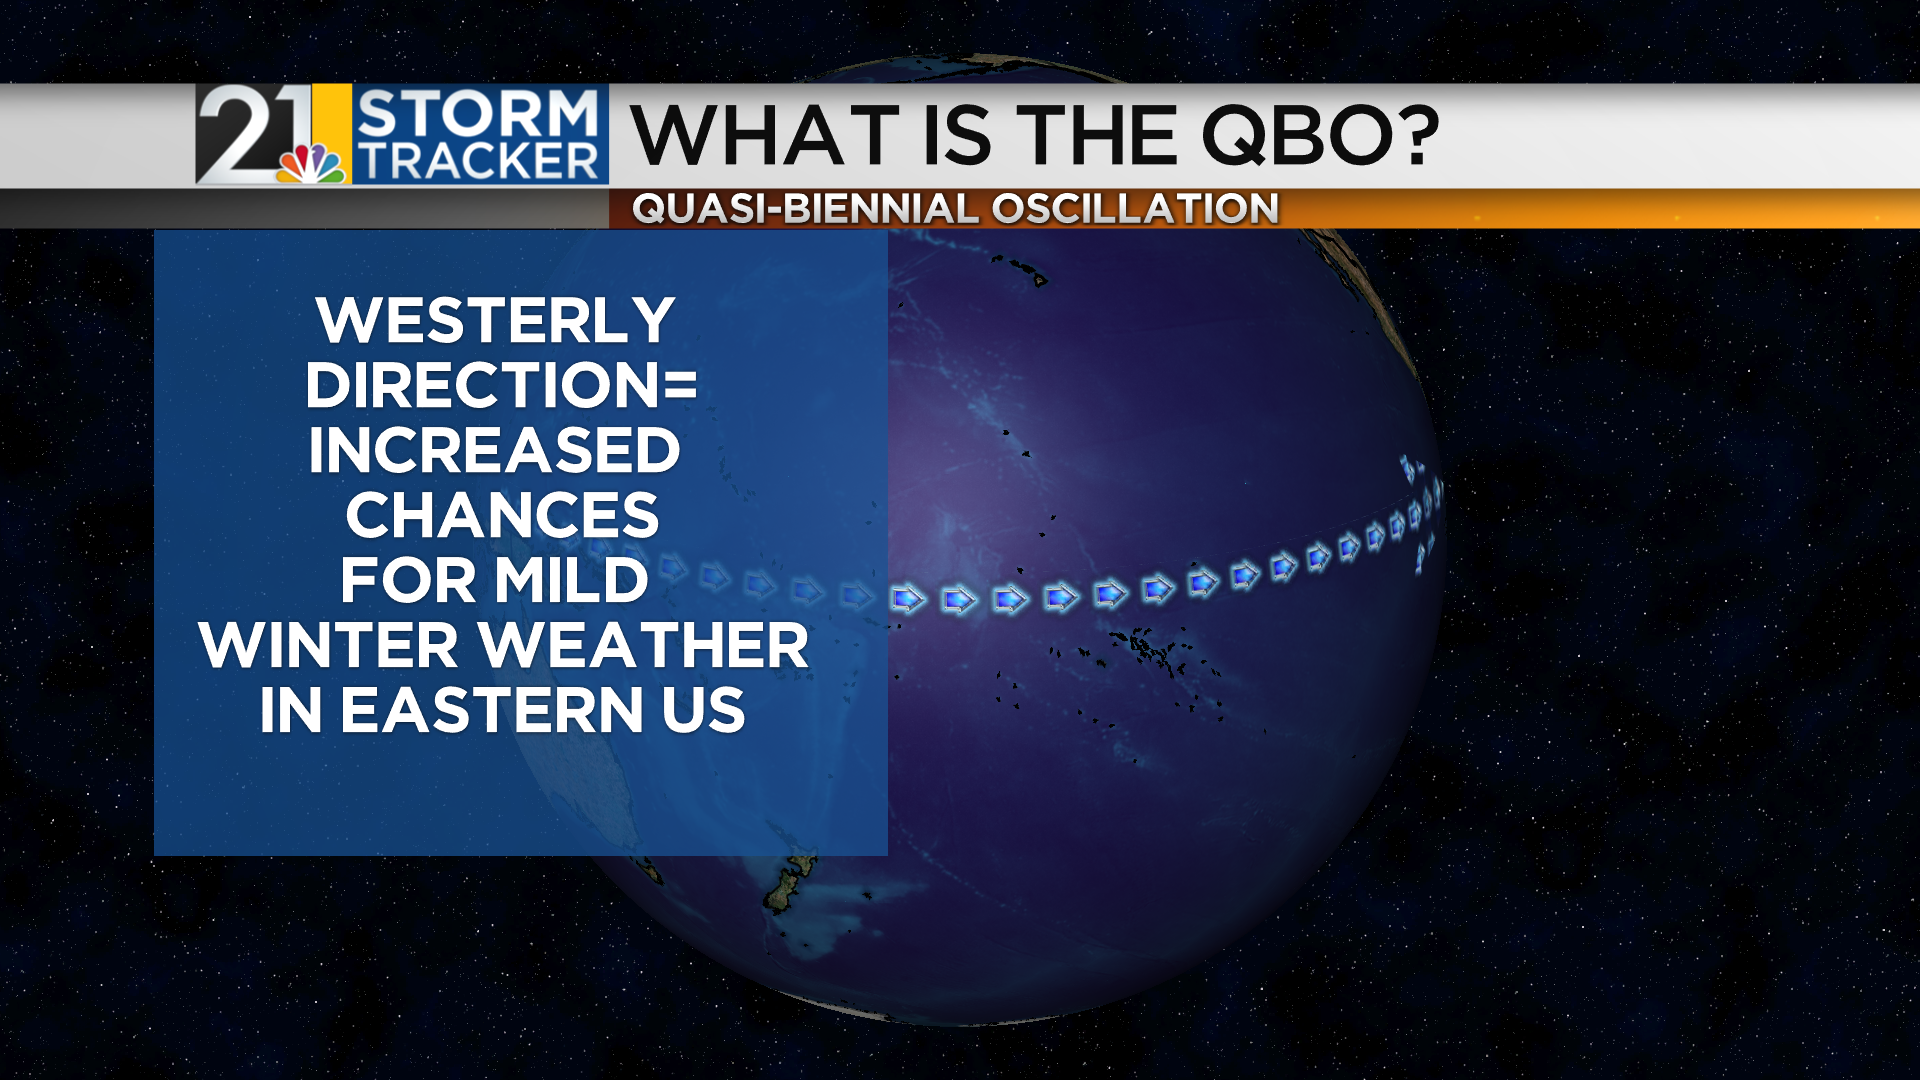
WHAT IS THE QBO??
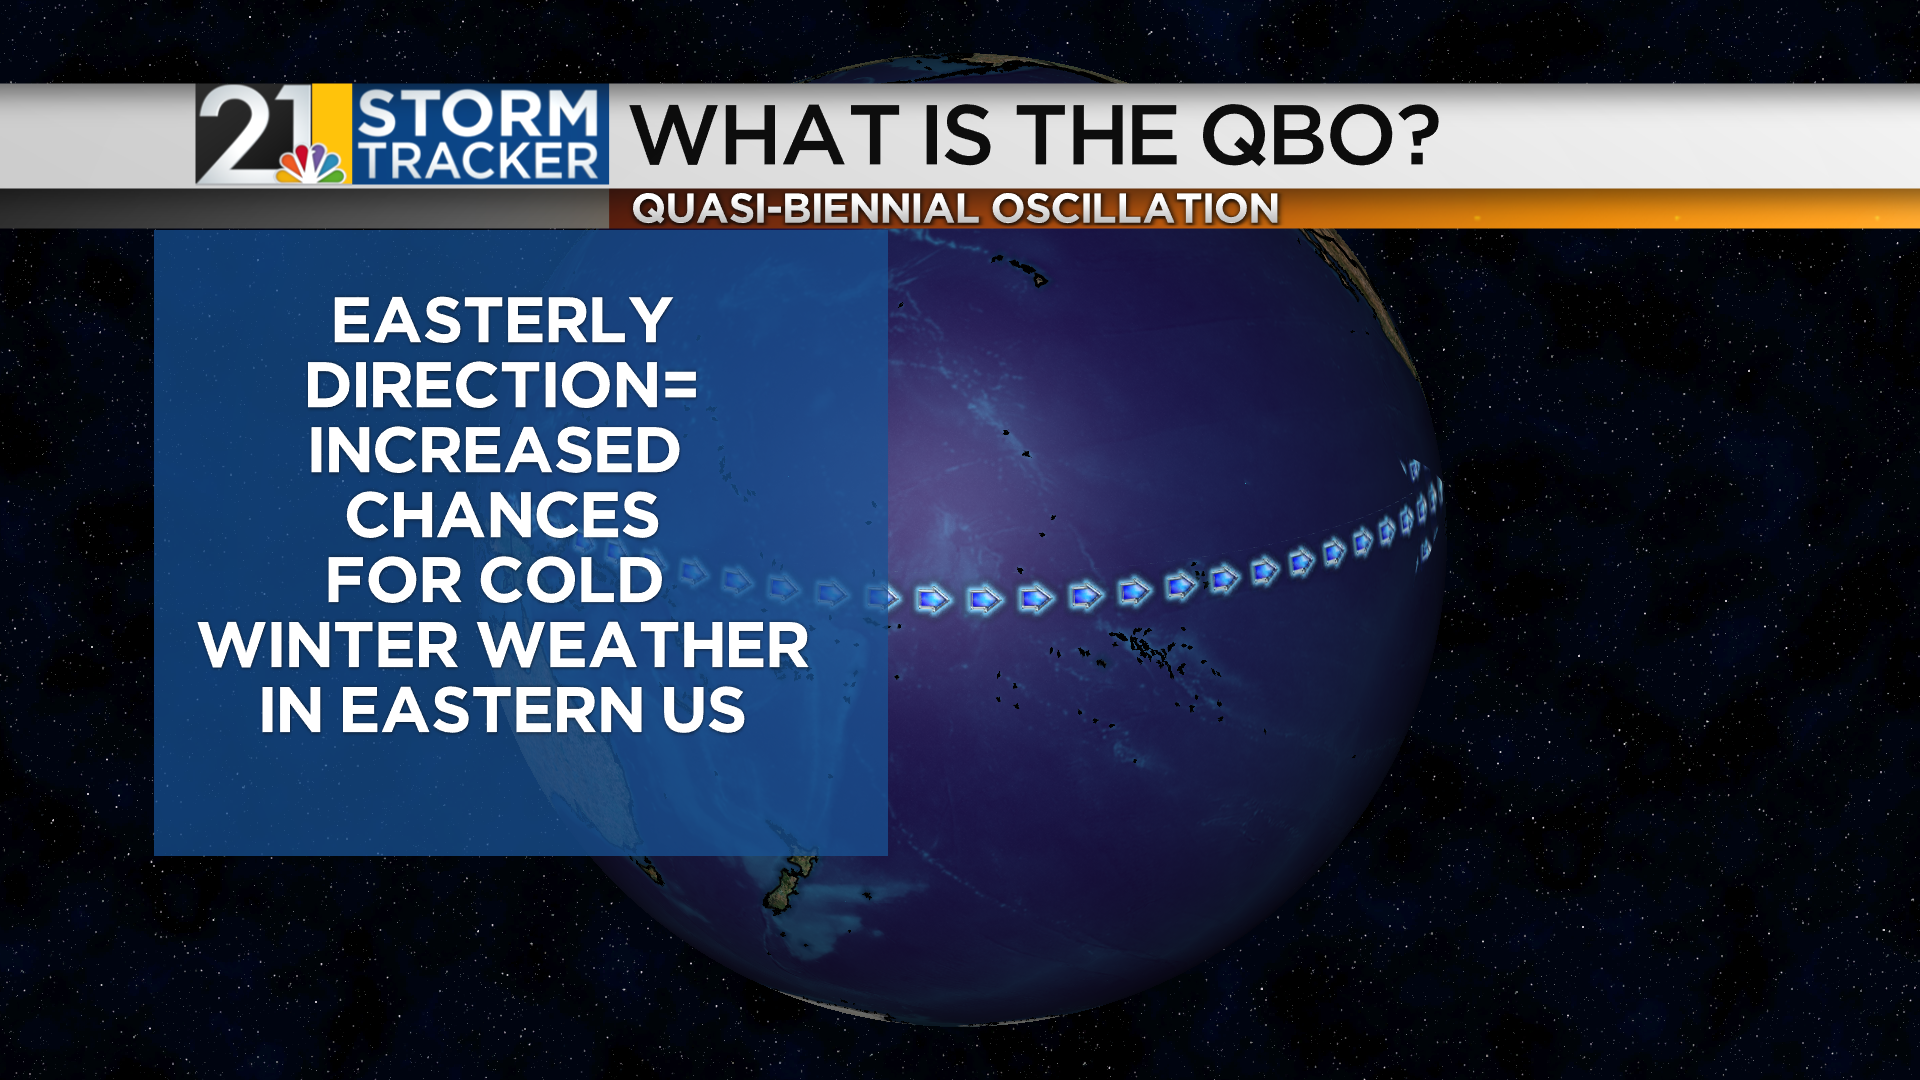
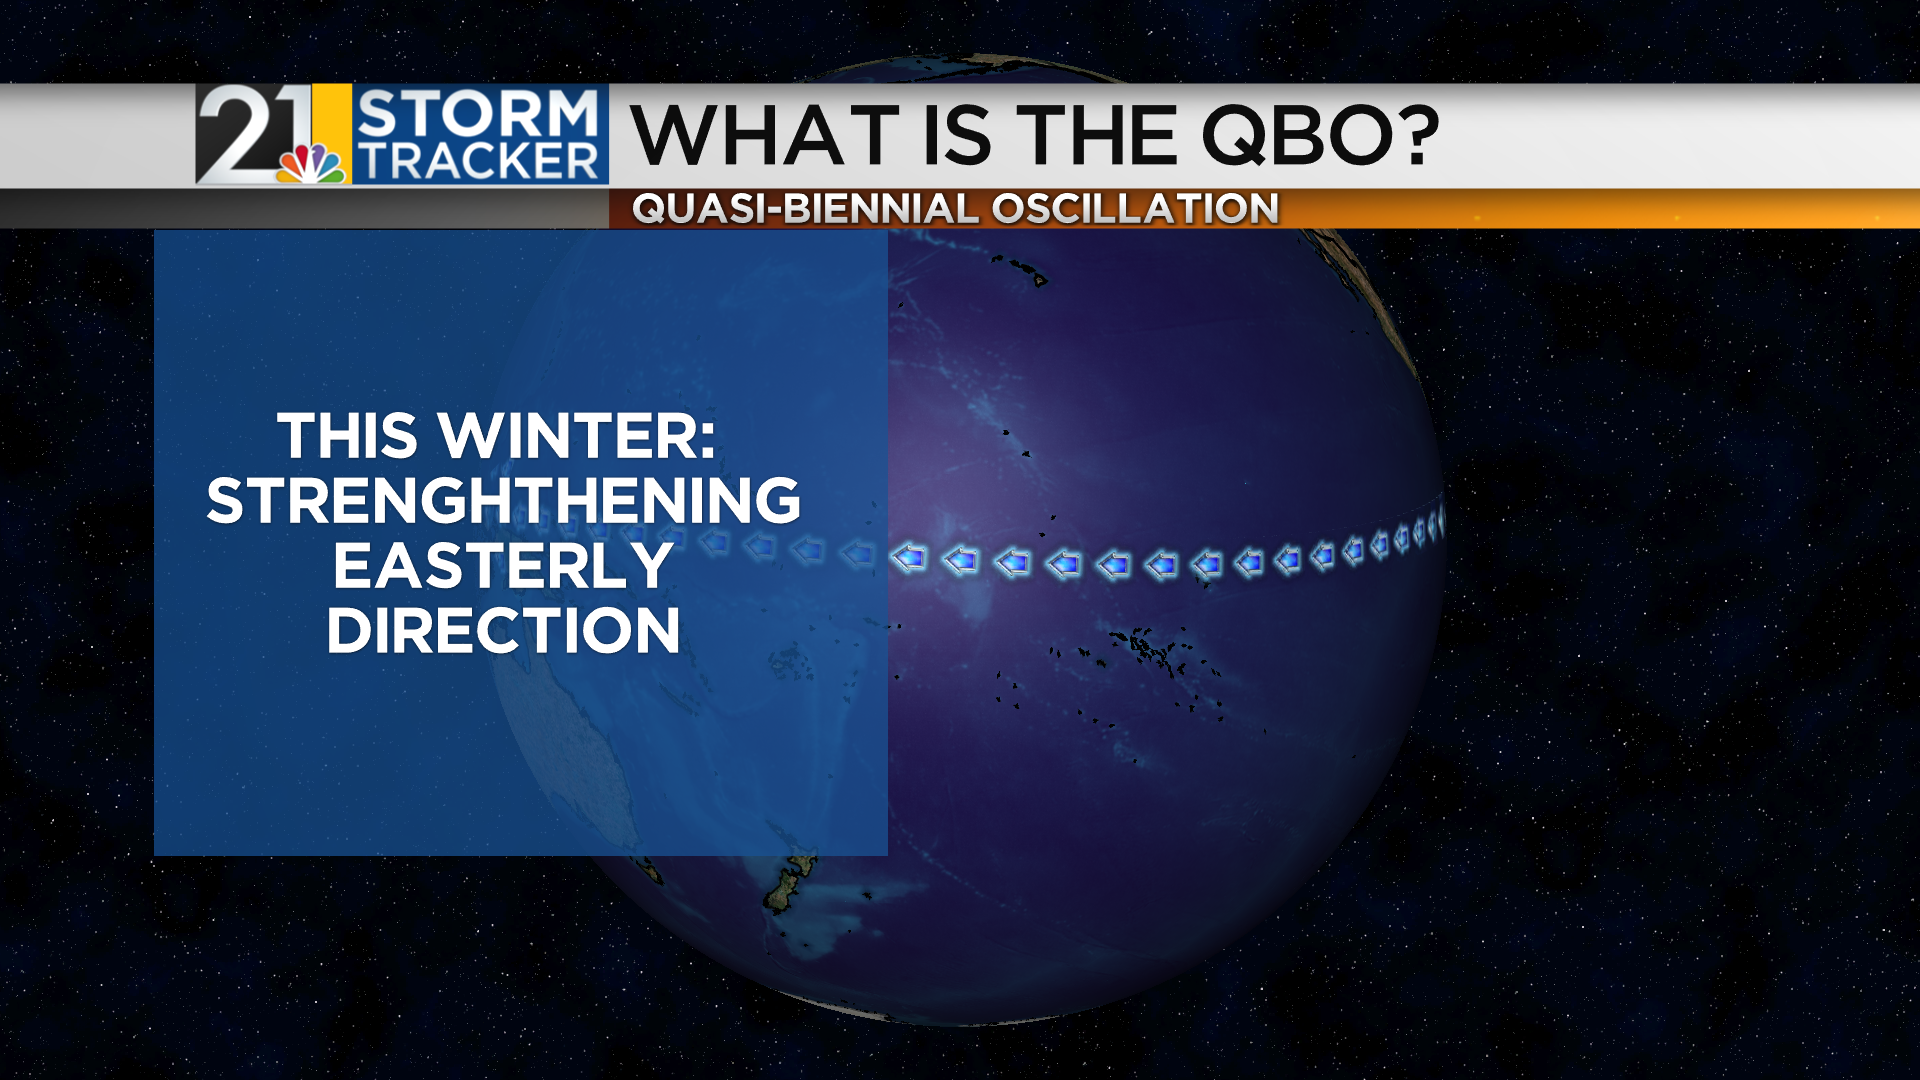
We look at the oceans a lot for these seasonal forecasts as the water temperature patterns can greatly influence the behavior of the atmosphere. But we also take note of the air wayyy above our heads, at the bottom of the stratosphere. The stratosphere is the 2nd layer of the atmosphere from the bottom. We live at the bottom of the troposphere but at the bottom of the stratosphere lies a river of air that can have an impact on winter weather patterns. The Quasi-Biennial Oscillation, or QBO, refers to the regularly oscillating wind pattern in this zone. When it’s in a westerly phase, often there is a lack of a “blocking” pattern over areas near the North Pole. The jet stream is more “zonal” and this keeps the cold air largely locked way up north. When it’s in the easterly (or “negative) phase, we tend to see more “blocky” weather patterns and this can force cold air south more frequently. The QBO is in that easterly or negative phase now and will continue to strengthen some as we head into winter.
SUNSPOT CYCLE
We are emerging from a period in which the Sun is very “quiet”, with a lack of sunspots. This 11-year cycle is known to have at least a little impact on actual weather during our winter season. Solar “minimums” tend to have a weaker polar vortex and more blocking (remember: more blocking means higher chances for cold, snow) and the opposite is true of solar maximums.
THIS YEAR’S ANALOGS
So, given all that was mentioned above, a weak-to-moderate 2nd year La Nina, occurring with a pool of cool water in the NE Pacific and warm water in the eastern Indian Ocean…along with an easterly (or “negative” QBO and just after a solar minimum…..what years appear to be most similar to this one?
Let’s start by saying no analog is a perfect match. On the list below there are years that are a closer match than others but this is the list of best matches since 1995. I did not use any years prior to 1995; it’s a somewhat arbitrary starting point but I do not think it’s all that useful to use years in the distant past. Climate change has made the oceans and atmosphere much warmer in recent decades and the world was just too different of a place “back in the day” to try to glean forecast ideas for a much warmer world.
3 of the 7 winters were cold. Those same winters were snowy. In fact, 2010-2011 is, easily, the snowiest winter on record here. The next year: a very warm winter with below average snow. See: no 2 La Ninas are alike.
COMPUTER MODELS
We have computer models that simulate the atmosphere for the next 24 hours, the next 7 days and even the next month. We also have “seasonal” models that project out several months. They are another tool in our tool belt but we have to know how to use them correctly.
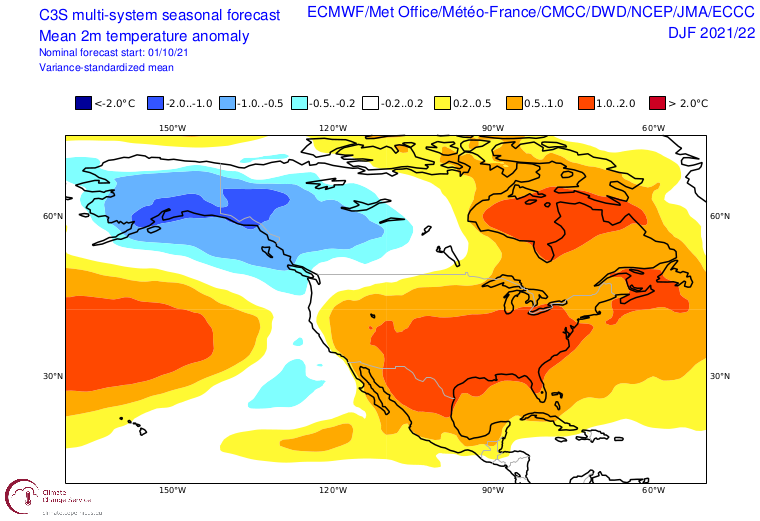
The current (as of November 4) blend of seasonal models paints a warm-looking picture across the central and eastern US this Winter.
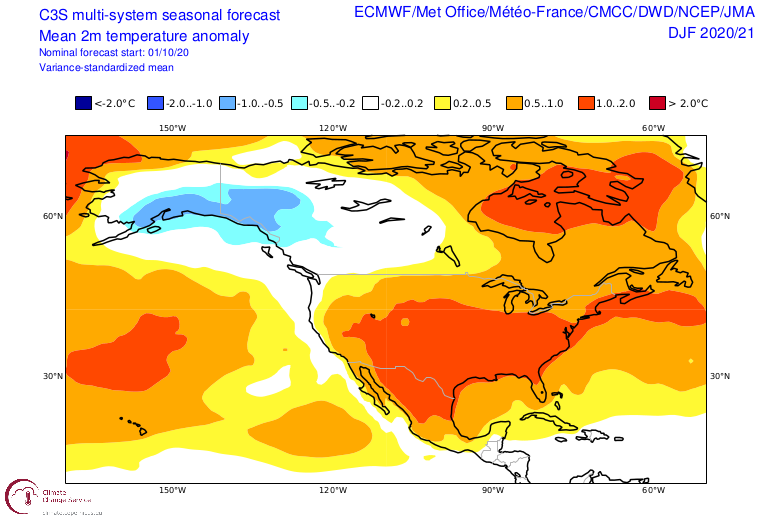
Notable and certainly something to consider, however, at this time last year this same model blend predicted the Winter of 2020-2021 would look like this:
Almost an identical forecast as this year. Here’s what actually happened: Oops.
THIS YEAR’S ANALOG BLEND
When you take those top analog years mentioned above and put them in the ol’ weather blender (with a few “scoops” of the best matching years to give them more weight), you get this for temperatures:
And this for precipitation:
SO WHAT’S THE FORECAST?
Ok, so considering the look of the analogs, the models, lessons learned from the past and more, what’s the forecast? I lean in the direction of this winter ending up near average temperature wise for our area. I do think that season will start out cold and December may be the coldest of the 3 months compared to average. Later in the Winter, the polar vortex will likely strengthen some and the pattern will become less blocky. This should result in periods of mild weather and perhaps some pretty significant warmth. The analogs suggest February could be quite balmy.
Nationally, the forecast is not as warm as the models but not as cold as the analog blend. Locally, I suspect the season ends up close to 2017-2018, wild swings but coming out in the wash as not far from average. That winter featured a wicked cold spell around Christmas, New Years but a very balmy February. The Spring was pretty grizzly with chilly temperatures, however.
The intensity of the NE Pacific cold pool makes me a bit nervous as it is similar to 2011-2012…a warm winter for us.
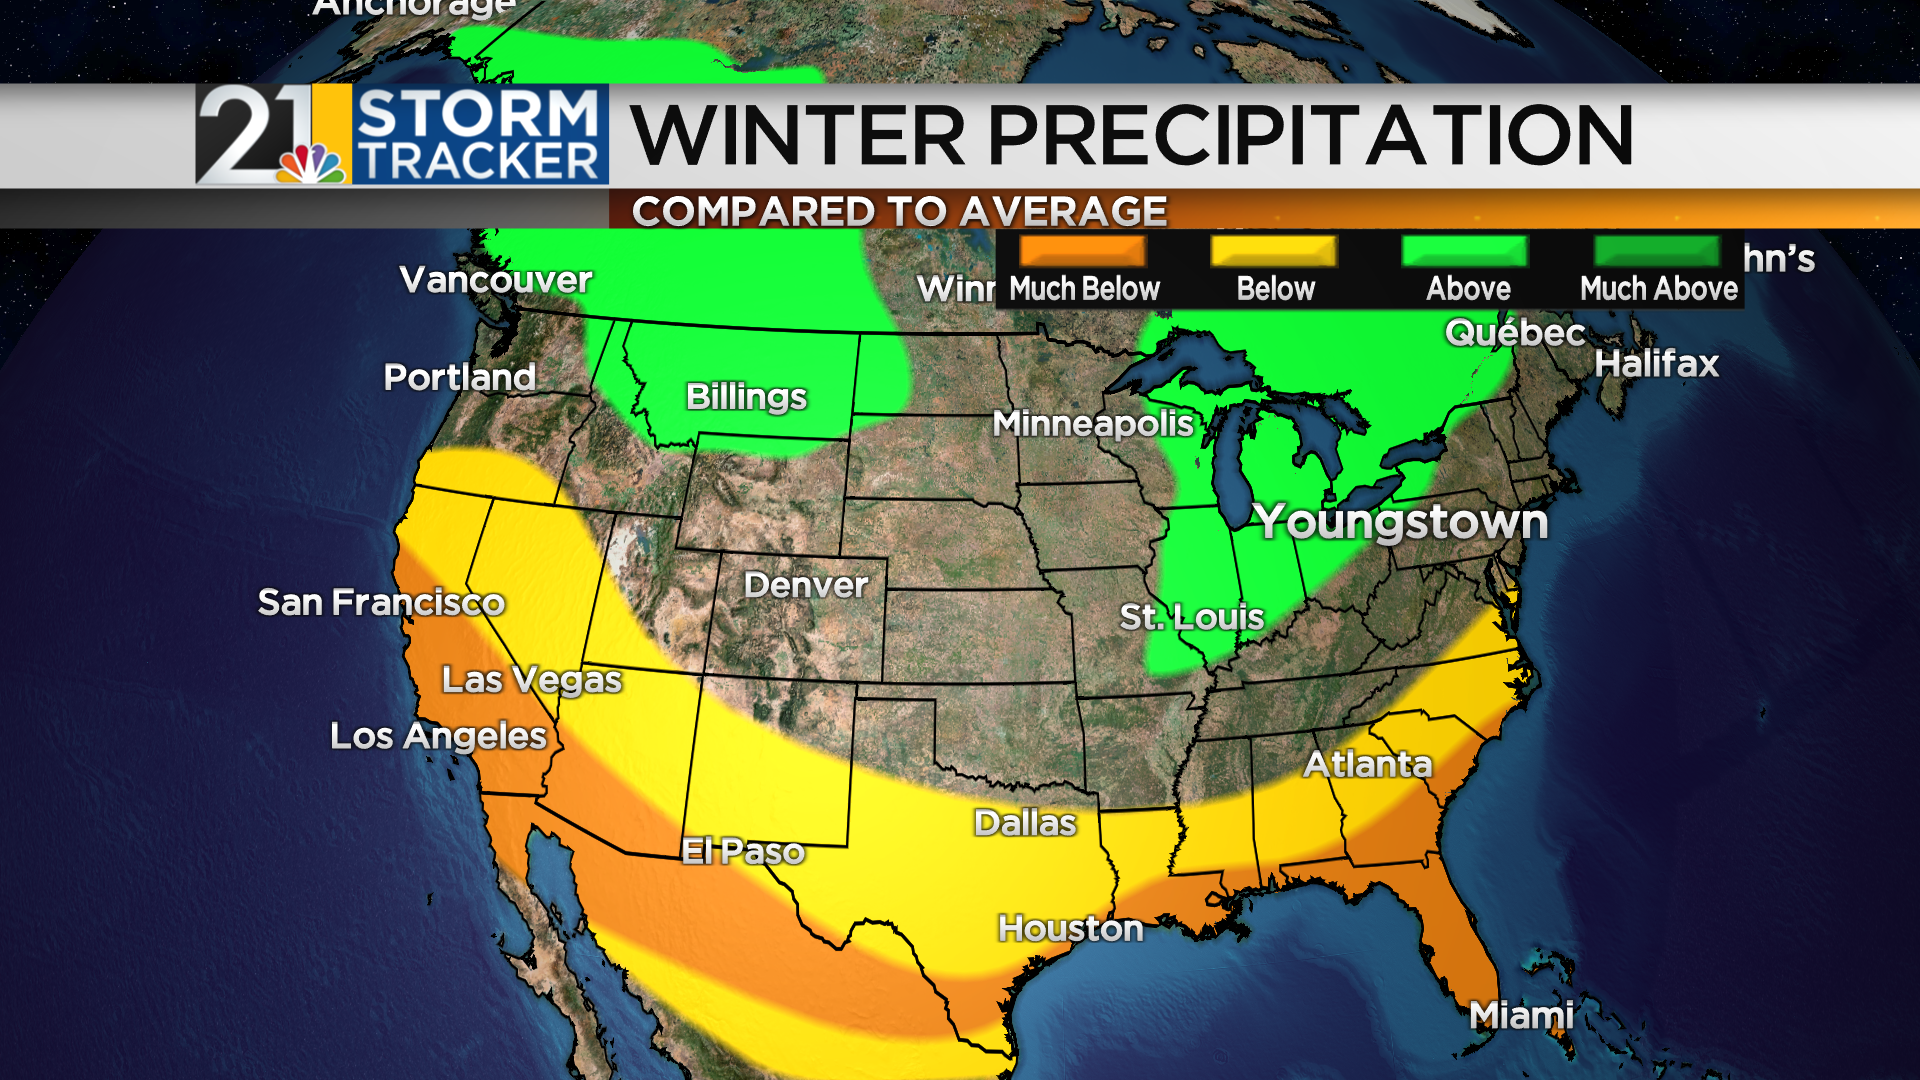
Overall, precipitation should end up above average. But how much of that will be snow? That’s the big question. Seasonal snow forecasts are hard; even in a relatively quiet winter, a couple of big storms can make it look like it was a crazy season.
This map shows the average snowfall (NOT this year’s forecast!) for our general region. Of course, lake-effect plays a big part in how this map looks.
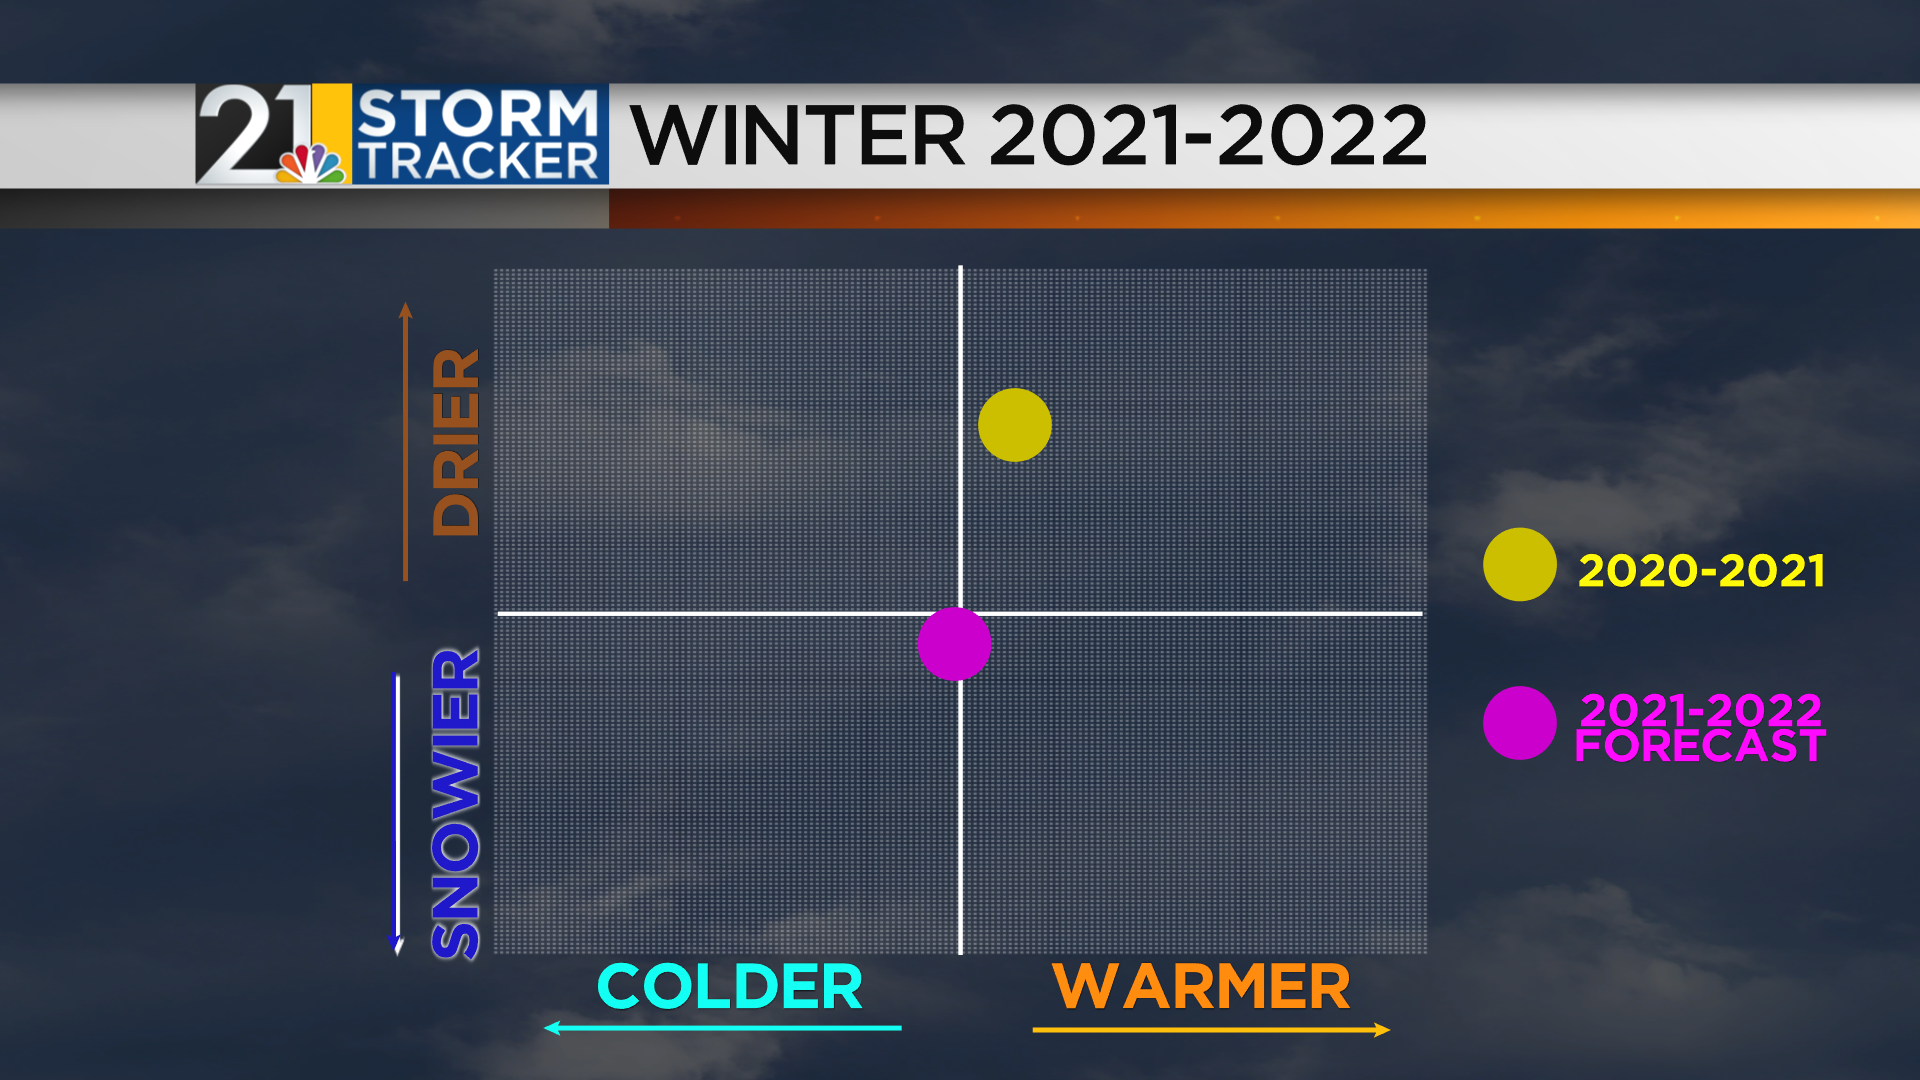
Here’s another way to break down the forecast. I think the highest odds are for a near average season temperature wise and for snow as well. There are somewhat higher odds of the winter ending up mild as opposed to cold (see nervousness about a 2011-2012 redux mentioned above). Odds slightly favor near-average snow but I would not be surprised if we ended up snowier-than average or a bit below average either (if the warmer winter fears pan out). The odds of another paltry year for snow are slightly higher than the odds of a blockbuster season although the chances of either outcome remains pretty low.
Comparing this winter to last: it should be snowier and at least a little colder.
This would result in more salt usage than last year and higher energy bills as well. However, thankfully for our bank accounts, a severe winter seems unlikely. I don’t think we will see a repeat of 2010-2011.
THE BOTTOM LINE
After 6 straight mild-to-warm winters, we have a decent chance of this one being closer to average and we certainly don’t want rule out our first colder-than-average winter since 2014-2015. December may be the most consistently cold and snowy month and the back half of winter could be a wild ride which includes periods of Spring Fever.
UPDATE IN A MONTH
As we have done for the last several years, an update will be issued in early December. We’ll see if any substantial changes are needed! Have a good Winter!
